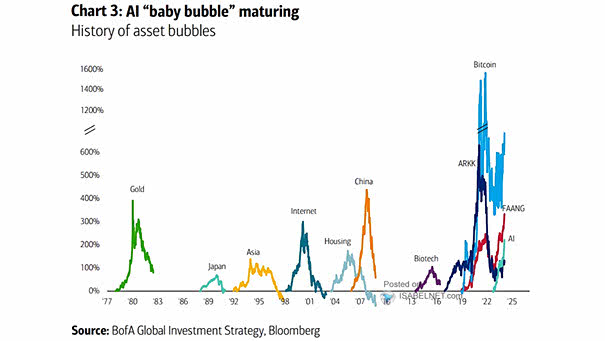
Stocks – Dow Jones with Major Geopolitical Events

Stocks – Dow Jones with Major Geopolitical Events Major geopolitical events can rattle markets, but U.S. equities have repeatedly bounced back and pushed higher as investors refocus beyond the headlines, rewarding those who stay patient. Image: Carson Investment Research

Estimated S&P 500 EPS and Y/Y Growth

Estimated S&P 500 EPS and Y/Y Growth Goldman Sachs is betting the earnings strength has legs, forecasting S&P 500 EPS growth of 24% in 2026 to $340, followed by 13% in 2027 to $385. If that plays out, it is hard to see equities lagging. Image: Goldman Sachs Global Investment Research

Indexed Market Cap and Consensus Fwd 12m EPS Estimates for S&P 500 Companies

Indexed Market Cap and Consensus Fwd 12m EPS Estimates for S&P 500 Companies Earnings momentum is driving the AI infrastructure complex’s outperformance so far this year, with capital flowing to names that are already translating AI demand into visible revenue growth, order strength, and profit expansion. Image: Goldman Sachs Global Investment Research

Weight of Top 10 Positions in Median Hedge Fund Long Portfolio

Weight of Top 10 Positions in Median Hedge Fund Long Portfolio Hedge fund portfolio density is now at 72% and holding firm, with greater concentration in top 10 positions. Such concentration leaves markets vulnerable to sharp swings if popular trades begin to reverse. Image: Goldman Sachs Global Investment Research

Annual U.S. Equity Issuance as % of Russell 3000 Market Cap

Annual U.S. Equity Issuance as % of Russell 3000 Market Cap “$600 billion in U.S. equity issuance in 2026” grabs attention and feeds the doom narrative. But relative to the total value of U.S. equities, it is not that large. Big number, yes, but scale matters. Image: Goldman Sachs Global Investment Research

New S&P 500 Index All-Time Highs Per Year

New S&P 500 Index All-Time Highs Per Year The S&P 500 has now reached 19 record highs this year. In strong bull markets, new highs tend to come in clusters and often run longer than investors expect, so long as growth and earnings keep delivering. Image: Carson Investment Research

Probability of U.S. Recession Calculated from the Yield Curve

Probability of U.S. Recession Calculated from the Yield Curve The probability of U.S. recession in 12 months, calculated from the yield curve, stands at 12.5%, keeping the expansion narrative intact. This cycle still has room to run. Image: Federal Reserve Bank of Cleveland

Cash Held by Households

Cash Held by Households Equity inflows are drawing support from the large cash buffers households built up during the pandemic, with a significant pool of savings still sitting on the sidelines. Image: Deutsche Bank Asset Allocation

Equities – Global Valuation Range

Equities – Global Valuation Range U.S. stocks carry a rich premium, while markets abroad sit closer to their historical ranges. The result is a global landscape where relative value is easier to find outside the U.S., though true bargains are still hard to come by. Image: Goldman Sachs Global Investment Research

S&P 500 Net Profit Margin

S&P 500 Net Profit Margin Profit margins are widening across the S&P 500 this year, extending beyond mega-caps and the tech sector. This trend should continue into 2027, pointing to a healthier and more diverse market outlook. Image: BCA Research

S&P 500 Performance After Eight Week Wins Streaks Up >12%

S&P 500 Performance After Eight Week Wins Streaks Up >12% An eight-week winning streak and a rise of more than 12% set the tone. Since 1950, U.S. stocks have followed up with a median 12-month return of 20.1% and have never finished lower. That is the kind of backdrop bulls like. Image: Carson Investment Research