Median 2-Week S&P 500 Returns
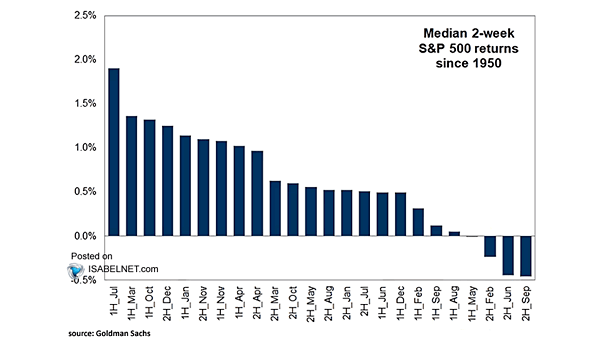
Median 2-Week S&P 500 Returns Since 1950, the first half of August has often been a drag on the S&P 500, ranking as the fifth-weakest half‑month of the year. Image: Goldman Sachs Global Investment Research
Median 2-Week S&P 500 Returns Since 1950, the first half of August has often been a drag on the S&P 500, ranking as the fifth-weakest half‑month of the year. Image: Goldman Sachs Global Investment Research
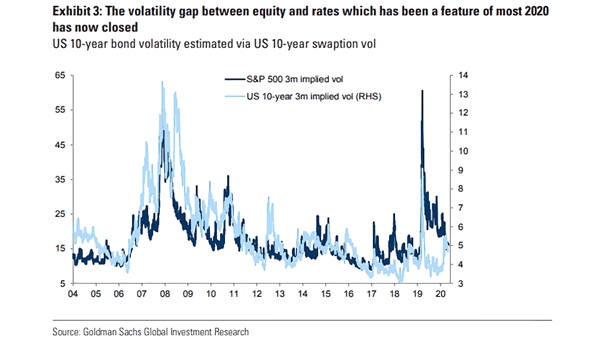
Implied Vol for Individual Stocks in the S&P 500 vs. the Index There’s a wide gap between single-stock implied volatility, which remains elevated, and index volatility, which is more moderate. Image: Deutsche Bank Asset Allocation
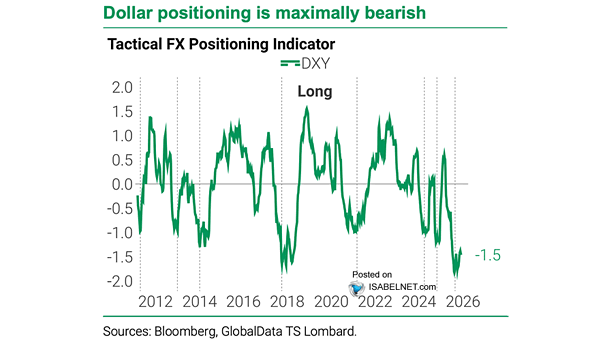
U.S. Dollar Index (DXY) and Purchasing Power Parity Valuation On key valuation metrics, the US dollar is still rich. That leaves little room for a sustained rally, especially as foreign demand has cooled since Liberation Day and valuations are already at the top of the range. Image: TS Lombard
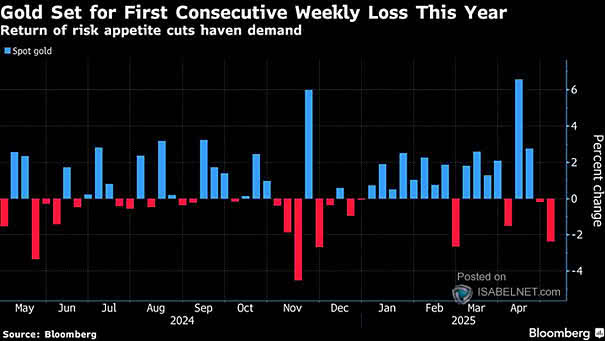
Spot Gold Gold is trading close to a seven-month low as a stronger dollar and expectations for higher-for-longer U.S. interest rates keep pressure on the metal. Image: MarketDesk Research
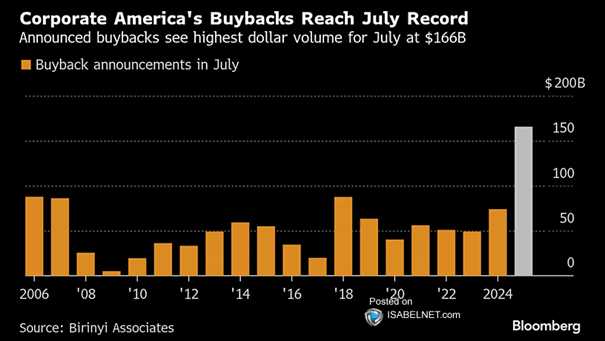
Announced Buybacks on Wilshire 5000 This year, announced buybacks are heading past $2 trillion, a new record. But there is a gap between what companies say and what they actually do. In practice, actual buybacks lag far behind the promises. Image: Bloomberg
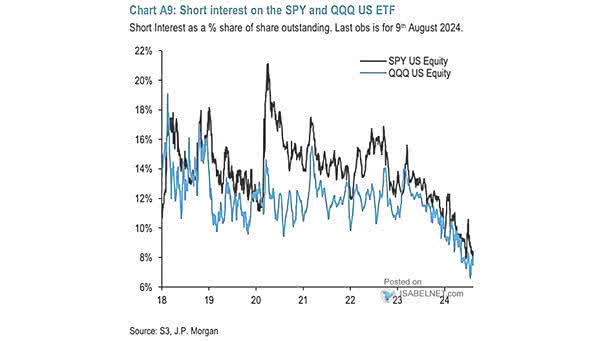
S&P 500 – Short Interest on the SPY and QQQ U.S. ETFs Short positions in the SPY and QQQ US ETFs remain muted, indicating limited appetite for downside speculation. The market is still more comfortable with upside than downside. Image: J.P. Morgan Flows and Liquidity
Magnificent Seven Stocks vs. S&P 500 – Cumulative Revenue Growth Since 2016 Since 2016, Mag 7 revenue has climbed 375%, versus 95% for the S&P 500. Earnings tell the same story. A flow-driven pullback can shake the tape, but it doesn’t change the decade-long compounding trend. Image: Real Investment Advice
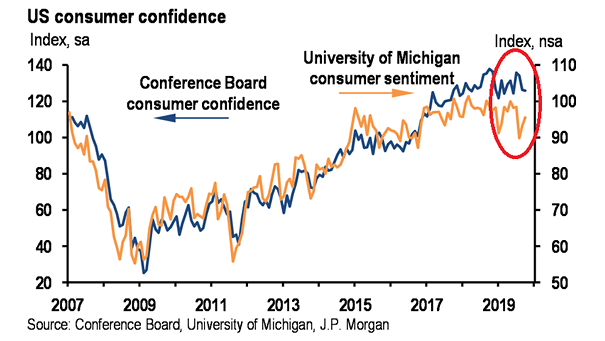
Consumer Sentiment Index and Subsequent 12-Month S&P 500 Returns When consumer confidence sinks, stocks often rebound anyway, turning lousy sentiment into fuel for gains. It’s a classic contrarian setup: the worse the mood, the better the returns. Image: J.P. Morgan Asset Management
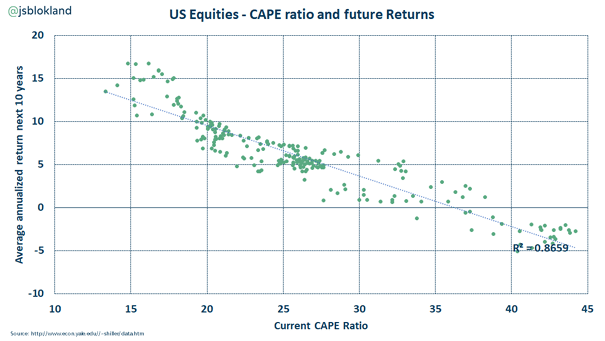
S&P 500 CAPE Ratio vs. U.S. Households Holding of Equities % Total Financial Assets When everyone is piled into equities and valuations are stretched, there isn’t much cushion left. History doesn’t say a crash has to follow, but it does show that markets priced for perfection rarely handle surprises well. Image: Topdown Charts
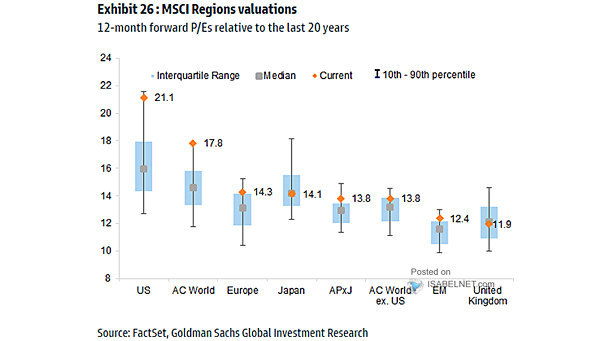
Valuations – 12-Month Forward P/E Ranges (MSCI Regions) U.S. and global equity valuations remain rich, but earnings are carrying the market for now. As long as profits hold up, that premium does not look like a major problem for investors. Image: Goldman Sachs Global Investment Research
Capex to Operating Cash Flow for U.S. and China Hyperscalers U.S. hyperscalers are on track to spend more than their operating cash flow in 2027. The market is no longer asking whether they can pay for it, but whether the AI spending will eventually deliver returns. Image: Goldman Sachs Global Investment Research