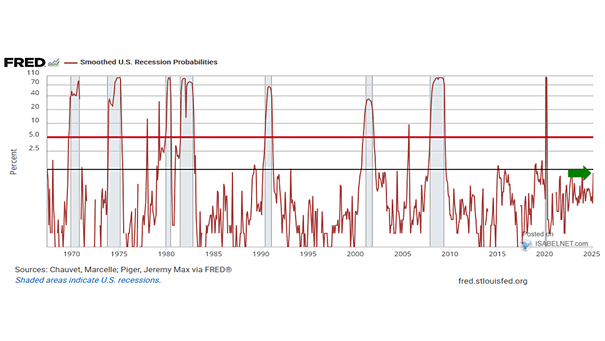
Smoothed U.S. Recession Probabilities

Smoothed U.S. Recession Probabilities The probability of U.S. recession stands at 0.60%. When this recession indicator exceeds 5% (red line), history suggests that the probability of recession increases significantly. The chart shows the smoothed U.S. recession probabilities indicator on a log scale. Smoothed U.S. recession probabilities are obtained from a dynamic-factor markov-switching model applied to…
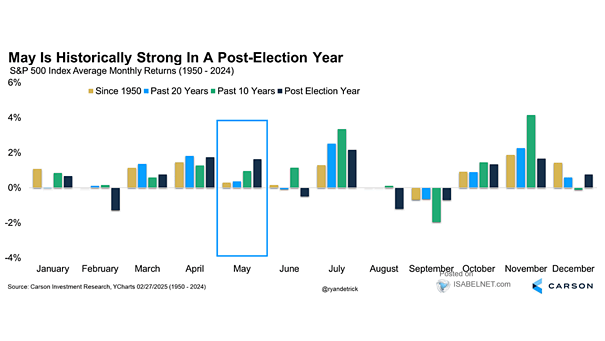
Seasonality – S&P 500 Index Average Monthly Returns

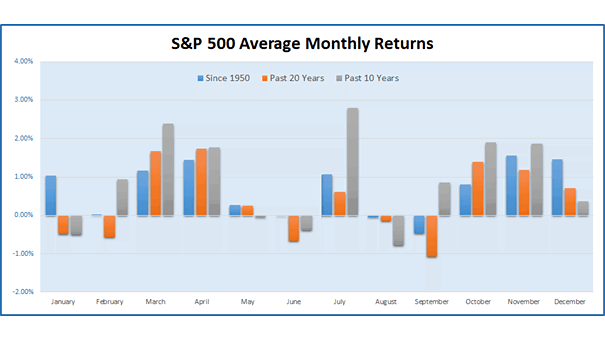
Seasonality – S&P 500 Index Average Monthly Returns History paints September as the worst month for U.S. stocks, with the weakest average return since 1950. But this year, August, typically sluggish in midterm years, is already up 3%. Do the odds look different this time? Image: Carson Investment Research

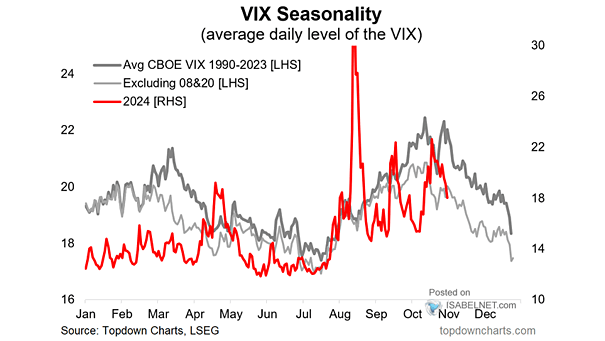
VIX Seasonality

VIX Seasonality Summer calm rarely lasts. U.S. stock volatility usually kicks in about now. Does this time break the pattern? Image: Topdown Charts

Distributions of Returns of S&P 500 Since 1928

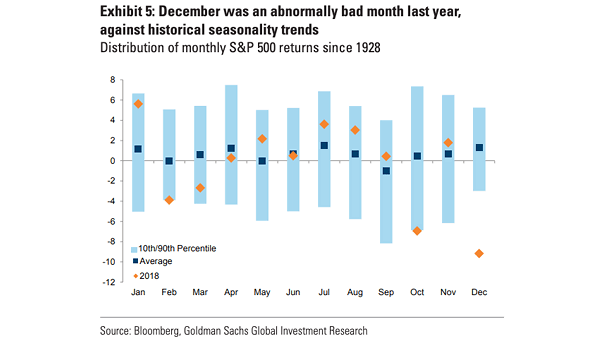
Distributions of Returns of S&P 500 Since 1928 The S&P 500 has run well ahead of its long‑term median over the past years, but that kind of strength will be tough to repeat from today’s valuation levels. Image: Goldman Sachs Global Investment Research

Sector Fund Flows

Sector Fund Flows Over the past 12 months, investors have piled into tech funds on the back of AI fever, chip strength and improving earnings outlooks. Can the momentum hold? Image: Deutsche Bank Asset Allocation

S&P 500 Average Monthly Returns Since 1964

S&P 500 Average Monthly Returns Since 1964 September is typically a weak month for U.S. equities, and midterm years tend to make it worse. Once Election Day passes, uncertainty lifts and markets frequently improve. Image: Real Investment Advice

S&P 500 Performance After a Positive August and YTD Between 10% and 17.5%

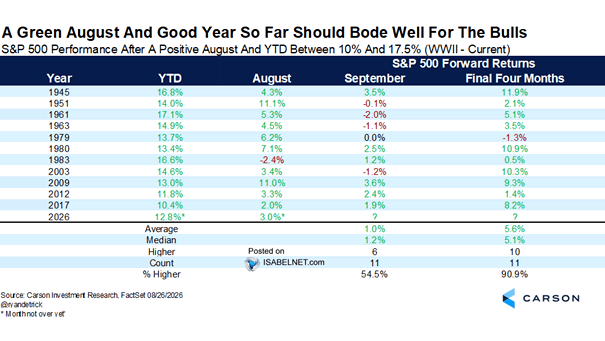
S&P 500 Performance After a Positive August and YTD Between 10% and 17.5% History says this setup is bullish. Since 1945, when August closed in the green with the market up between 10% and 17.5% year-to-date, September through December rallied 91% of the time, with an average 5.6% return. Image: Carson Investment Research

U.S. Equity Market Capitalization

U.S. Equity Market Capitalization Since ChatGPT launched, multiple expansion has contributed 25% of the surge in U.S. market cap, crushing the equity risk premium and leaving little room for error if AI demand or earnings disappoint. Image: BCA Research

S&P 500 and 10-Year Yield Correlation

S&P 500 and 10-Year Yield Correlation Daily moves in U.S. stocks and 10-year UST yields have turned sharply negative, eclipsing 2022 levels. But over the past four years, it has been the volatility of rates, not their level, that has driven equity returns. Image: Deutsche Bank Asset Allocation

PHLX Semiconductor Index Intra-Year Declines vs. Calendar Year Returns

PHLX Semiconductor Index Intra-Year Declines vs. Calendar Year Returns Every year, the PHLX Semiconductor Index makes investors sit through an average 30% drawdown. But it has closed higher in 20 of the last 31 years. Welcome to the cost of long-term alpha in semis. Image: J.P. Morgan Asset Management

Share of Mutual Funds Outperforming Benchmarks

Share of Mutual Funds Outperforming Benchmarks 42% of large-cap mutual funds are beating their benchmarks, still above the long-term average of 37%. The catch? Most managers who beat the market one period can’t do it again the next. Image: Goldman Sachs Global Investment Research