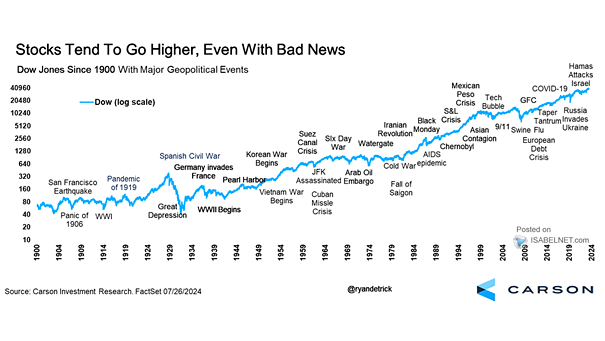
Equity Fund Flows vs. S&P 500 EPS Growth

Equity Fund Flows vs. S&P 500 EPS Growth Investors are pouring into equities on the back of solid earnings momentum. As long as earnings hold up, the trend should carry on. Image: Deutsche Bank Asset Allocation

Volatility – VIX and SKEW Index

Volatility – VIX and SKEW Index The VIX–SKEW divergence is less about calm and more about caution. Volatility looks subdued, but the steady rise in SKEW suggests investors are quietly paying up for protection against a downside shock. Image: Real Investment Advice

Dow Jones Performance Under Various Federal Reserve Bank Chairs

Dow Jones Performance Under Various Federal Reserve Bank Chairs The Dow has performed well under Jerome Powell, delivering an annualized return of 8.4%, comfortably above the long-term average of 6.2%. That puts him 8th among the 16 Fed chairs. Will Kevin Warsh do better? Image: Carson Investment Research

Truck Tonnage vs. S&P 500 Index

Truck Tonnage vs. S&P 500 Index The Truck Tonnage Index remained unchanged in April. Trucks represent 72.7% of U.S. freight and serve as a barometer of the U.S. economy. This chart shows that, historically, the U.S. stock market has tended to increase in line with the physical size and expansion of the U.S. economy (R²…

2-Month U.S. Equity/U.S. 10-Year Bond Yield Correlation

2-Month U.S. Equity/U.S. 10-Year Bond Yield Correlation The two-month correlation between U.S. equities and 10-year yields has broken down to late-1990s extremes, typically a recipe for higher volatility and greater pressure on duration-sensitive sectors, especially growth stocks. Image: Goldman Sachs Global Investment Research

S&P 500 Valuations

S&P 500 Valuations The U.S. market looks cyclically overheated. Valuation composites show stretched conditions, raising the risk of a sharp correction. So far, however, recession signals remain absent. Image: Topdown Charts

After Narrow Market Leadership: Drawdowns in the Leading Sector

After Narrow Market Leadership: Drawdowns in the Leading Sector Across decades, concentrated leadership has signaled fragile market health: when only a few sectors drive gains, weakening breadth tends to precede sharp declines. Image: Real Investment Advice

S&P 500 Performance per Year of a 4-Year Presidential Cycle

S&P 500 Performance per Year of a 4-Year Presidential Cycle Midterm years have a reputation for shaky markets. History tells a different story in second presidential terms, with U.S. stocks averaging an 8.8% gain since 1950. Those midterm jitters tend to fade quicker than investors expect. Image: Carson Investment Research

S&P 500 – Margin Debt Expansion vs. Contraction

S&P 500 – Margin Debt Expansion vs. Contraction Margin debt is surging into territory that has some investors on edge, firmly in what many would call the danger zone. For now, momentum still favors the upside, but any reversal could quickly raise red flags. Image: Topdown Charts

U.S. ETF and Mutual Fund Flows

U.S. ETF and Mutual Fund Flows Over the past year, U.S. investors have favored bonds and money market funds over riskier equities, with geopolitical tensions hanging over markets and interest rates staying elevated. Image: Goldman Sachs Global Investment Research

Citi Economic Surprises

Citi Economic Surprises The U.S. economy has held up better than its peers since the Middle East conflict escalated, as growth prospects elsewhere have dimmed, pushing investors toward the U.S. as the steadier bet. Image: TS Lombard