Semiconductor Earnings vs. Hyperscaler Free Cash Flows
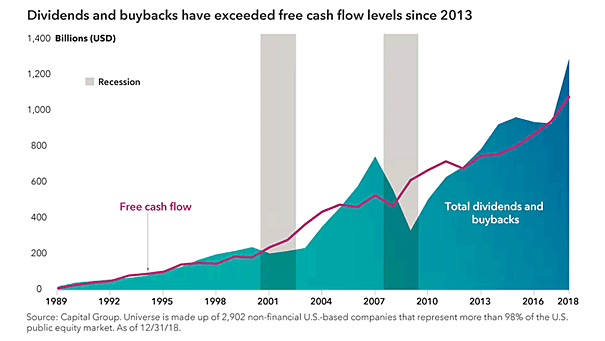
Semiconductor Earnings vs. Hyperscaler Free Cash Flows Semiconductor earnings are riding the AI capex wave, but hyperscaler free cash flow is taking a hit as spending on chips, data centers, and networking accelerates. Image: Goldman Sachs Global Investment Research