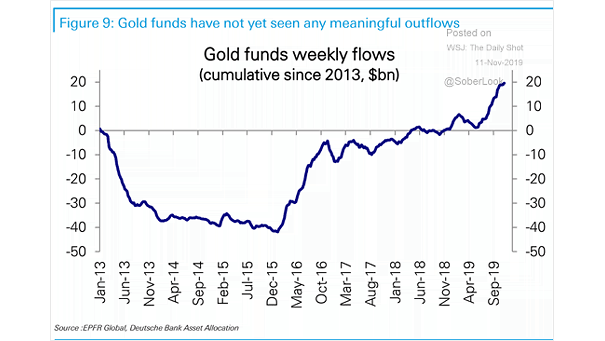
Gold Funds Weekly Flows
Gold Funds Weekly Flows Chart showing that gold funds have not yet seen any meaningful outflows. Image: Deutsche Bank Global Research
Gold Funds Weekly Flows Chart showing that gold funds have not yet seen any meaningful outflows. Image: Deutsche Bank Global Research
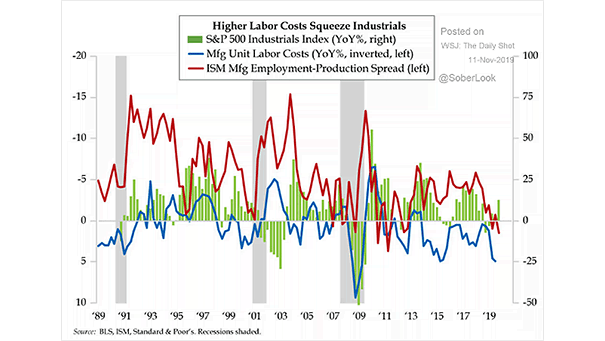
S&P 500 Industrials Index and U.S. Manufacturing Unit Labor Costs When U.S. labor costs rise, industrial profit margins are under pressure. Image: Quill Intelligence, LLC
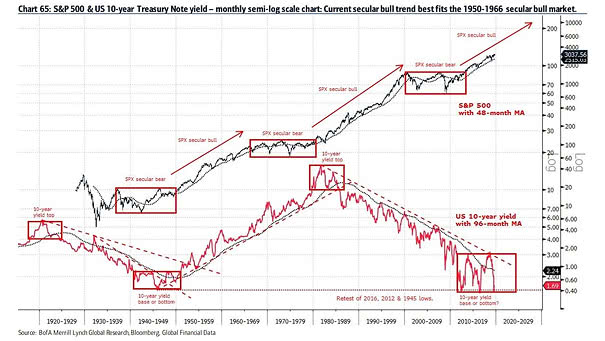
Secular Bull Market: S&P 500 and U.S. 10-Year Treasury Note Yield Chart suggesting that the current secular bull trend best fits the 1950-1966 secular bull market. Image: BofA Merrill Lynch Global Research
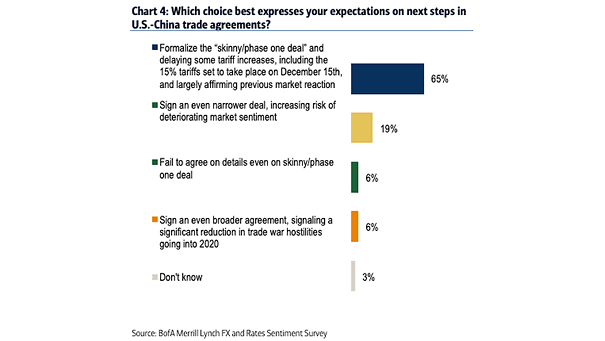
Survey: US-China Trade Agreements About the “phase one deal”, the latest BofA Merrill Lynch edition of the FX and rates sentiment survey shows that 65% of fund managers see a skinny agreement, delaying some tariff increases. Image: BofA Merrill Lynch
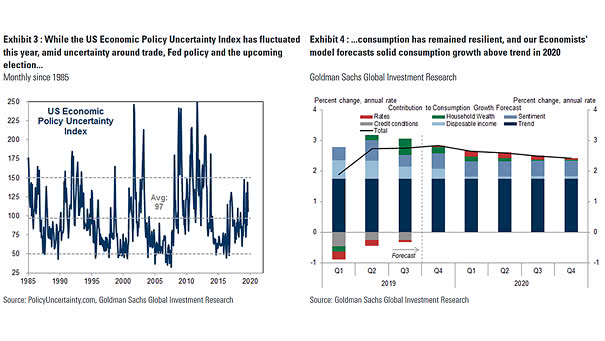
U.S. Economic Policy Uncertainty Index and Consumption Growth Forecast Goldman Sachs economists’ model forecasts solid consumption growth above trend in 2020, despite policy uncertainty. Image: Goldman Sachs Global Investment Research
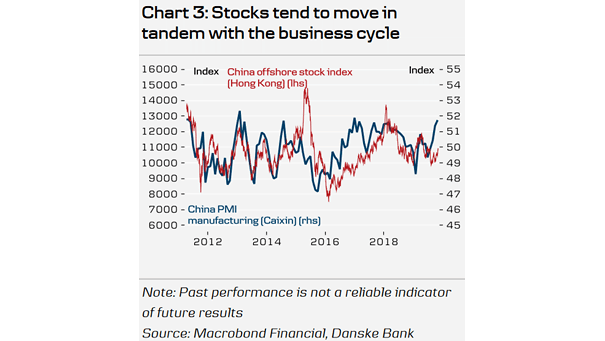
China Offshore Stock Index (Hong Kong) and China Manufacturing PMI Chart suggesting that the Chinese stock market has more upside. Image: Danske Bank
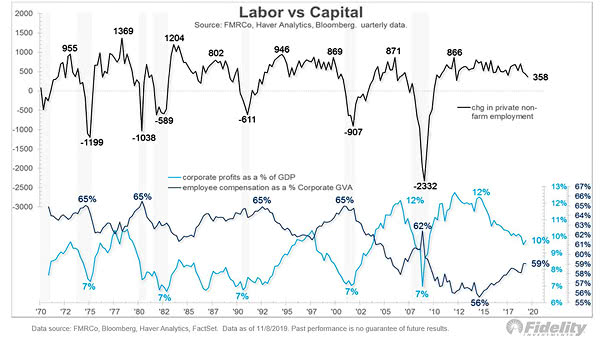
U.S. Business Cycle: Private Non-farm Employment, Corporate Profits and Employee Compensation This chart highlights the decline in corporate profits and rising wages, one characteristic of the late stage of the business cycle. Image: Fidelity Investments
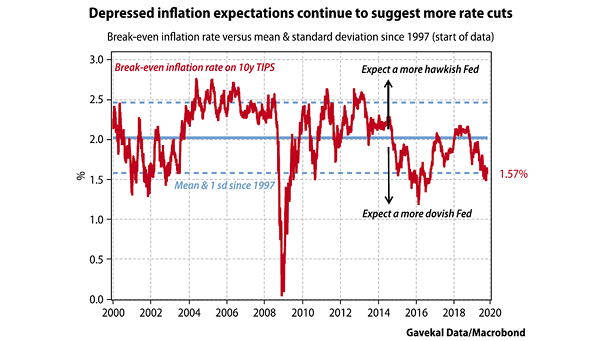
Break-Even Inflation Rate On 10-Year TIPS and Fed Rate Cut (Hike) If inflation expectations continue to fall or remain low, the Fed could probably cut rates further. Image: Gavekal
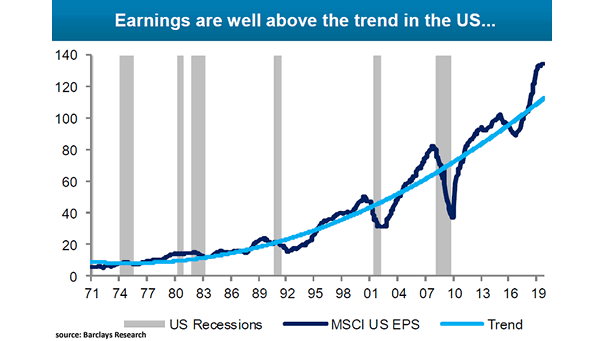
MSCI U.S. EPS vs. Trend History shows that earnings well above the trend in the U.S. precede earning plunges. Image: Barclays Research
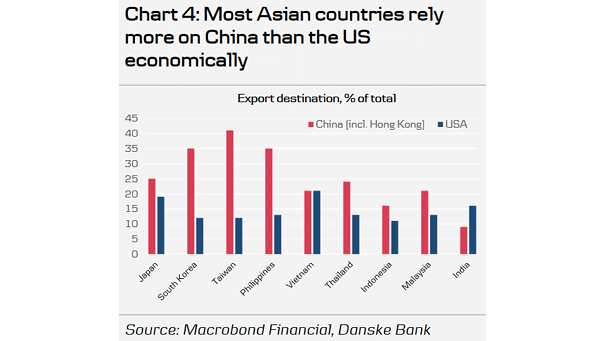
Export Destination: China vs. USA China is the largest export market of most Asian countries. Image: Danske Bank
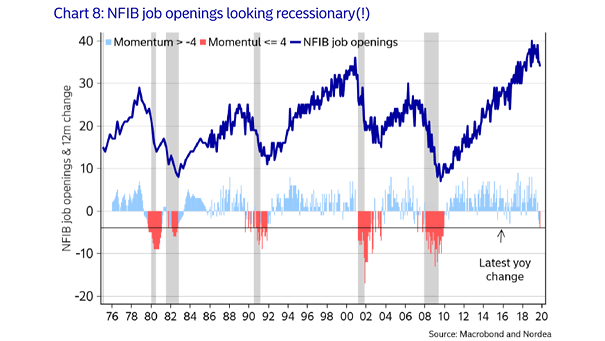
NFIB Job Openings and Recessions This chart shows that NFIB job openings, while high, could suggest a looming recession. Image: Nordea and Macrobond