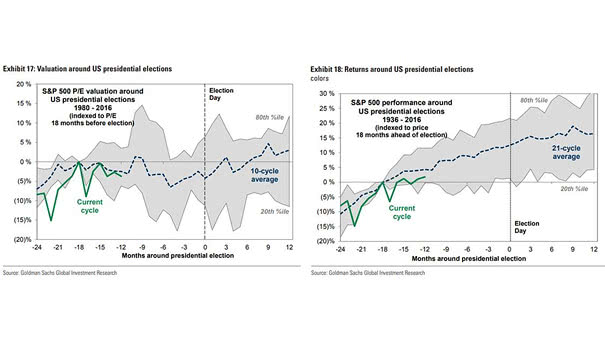
China M1 Money Supply Growth Leads MSCI World Index
China M1 Money Supply Growth Leads MSCI World Index Chart suggesting that China M1 money supply growth leads the MSCI World Index by 6 months. Image: Paolo Cardena
MSCI World Growth Index vs. MSCI World Value Index Over the past decade, global value stocks have remained in the shadow, while the sun has shone on global growth stocks. Image: Financial Times
The Treadmill of U.S. Oil Shale Chart suggesting that the treadmill of U.S. shale is accelerating. Image: Goldman Sachs Global Investment Research
Global Financial Conditions Index and Global Manufacturing PMI Chart suggesting that easier financial conditions should feed through to growth, unless monetary policy is less effective. Image: Goldman Sachs Global Investment Research
MSCI World Index vs. OECD Unemployment Rate and U.S. Consumer Confidence Chart suggesting that OECD unemployment troughs and very confident U.S. consumers do not generally bode well for global equities. Image: Morgan Stanley Research
Quality of Institutions and GDP This interesting chart shows how six components of quality of governance control of corruption, (governement effectiveness, stability and absence of violence, regulatory quality, rule of law, voice and accountability) correspond to GDP per capita. Image: Macrobond
Global Manufacturing PMI and Multi-Asset Portfolio of Cyclicals Using global manufacturing PMI to trade cyclicals in different business cycle phases. Image: J.P. Morgan
Cumulative S&P 500 Buybacks 2009-2019 Are buybacks driving the show? Thanks to tax cuts and low interest rates, corporate stock buybacks are booming. Over the past decade, S&P 500 companies bought back $5 trillion shares, while cumulative flows from households and foreigners are only a drop in the bucket. But what would happend if companies reinvested instead…
Volatility Across U.S. Presidential Elections Chart showing that outside of recessions, U.S. presidential elections did not contribute much to the volatility of equities, rates and forex. Image: Deutsche Bank Global Research
Emerging Markets Credit Growth Chart showing that credit growth in most emerging markets is still growing at a sustained pace. Image: Oxford Economics
U.S. Leading Economic Index (LEI) and Calibrated Recession Index The Calibrated Recession Index suggests a low probability of U.S. recession over the next 4-6 months. U.S. recession odds for 2020 are 40%. Image: Oxford Economics