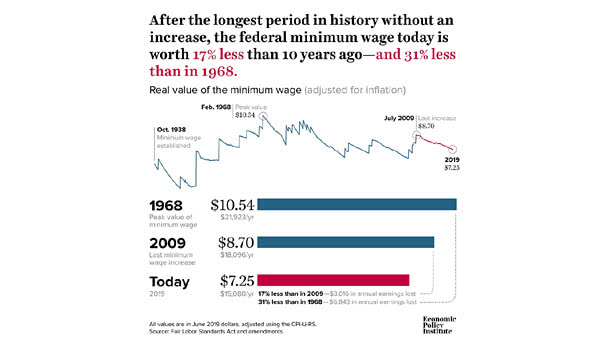
Global Economy Is Late Cycle

Global Economy Is Late Cycle This chart shows that a record number of fund managers think the global economy is late cycle. Image: Bank of America Merrill Lynch

ISM Manufacturing Index vs. Cass Freight Index

ISM Manufacturing Index vs. Cass Freight Index The Cass Freight Index (white bar chart) is a measure of monthly North American freight activity. It suggests that the ISM Manufacturing Index (green line) could go lower if the U.S. economic slowdown persists. Image: Greg S.

U.S. Recessions since 1957

U.S. Recessions since 1957 This chart shows that almost every Fed rate cut has been associated with a recession. Image: John P. Hussman

Debt and Demographics

Debt and Demographics Our world is aging with high levels of debt and low interest rates (maybe for a long time). Image: Fidelity Investments

GDP Growth Differential: U.S. vs. European Union

GDP Growth Differential: U.S. vs. European Union U.S. GDP growth has been stronger than in the European Union in 28 of the last 40 quarters. It can explain why the U.S. dollar has been so strong relative to the euro. Image: Brandywine Global

MSCI ACWI ex-U.S. and S&P 500 Index

MSCI ACWI ex-U.S. and S&P 500 Index U.S. equities have significantly outperformed the rest of the world in recent years, but this has not always been the case. You may also like “Trailing 12-month Return Differential between U.S. and non-U.S. Stocks.” Image: ClearBridge Investments

Performance of Hedge Fund Index vs. S&P 500

Performance of Hedge Fund Index vs. S&P 500 Hedge fund returns have not been as good as those of the S&P 500, but volatility has been lower. Image: Richardson Wealth

The U.S. Unemployment Rate Is Historically Low

The U.S. Unemployment Rate Is Historically Low But the FOMC projection suggests that the unemployment rate cannot improve indefinitely. Image: Federal Reserve Bank of Richmond

Increased Number of Zombie Companies

Increased Number of Zombie Companies Artificially low interest rates and investor demand for leveraged loans have created zombie firms. Image: Jupiter Asset Management

New Secular Bull Market?

New Secular Bull Market? This chart shows a perspective on secular bull and bear markets since 1930. Picture Source: ClearBridge Investments

Strength of Economic Expansions

Strength of Economic Expansions The current business cycle is the longest expansion, but it’s also the weakest. Picture Source: ClearBridge Investments