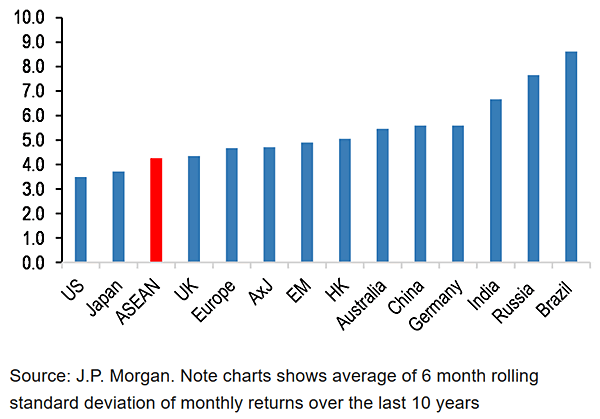
Sep 26 2019 Off Distributions of Volatility by Countries This chart shows the average of 6-month rolling standard deviation of monthly returns over the last 10 years.Image: J.P. Morgan