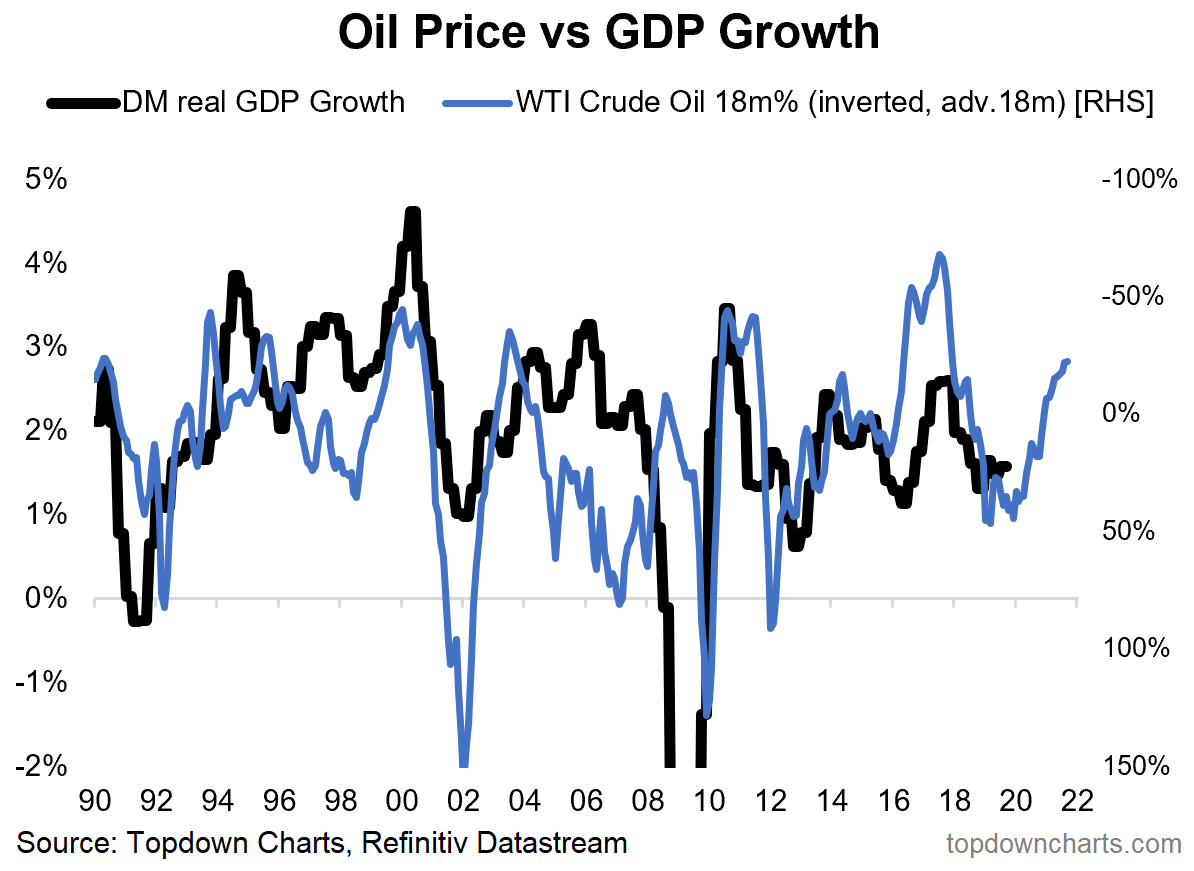
Feb 08 2020 Off DM Real GDP and WTI Crude Oil (Leading Indicator) Chart suggesting that the 18-month rate of change of WTI crude oil (inverted) tends to lead DM real GDP by 18 months.Image: Topdown Charts