S&P 500 Earnings Estimates
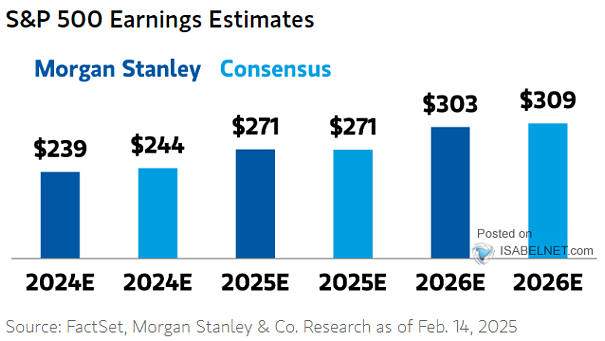
S&P 500 Earnings Estimates The projected forecast by Morgan Stanley suggests that S&P 500 earnings per share will rise to $229 in 2024 and $266 in 2025, pointing towards favorable prospects for profitability and growth.…
S&P 500 Earnings Estimates The projected forecast by Morgan Stanley suggests that S&P 500 earnings per share will rise to $229 in 2024 and $266 in 2025, pointing towards favorable prospects for profitability and growth.…
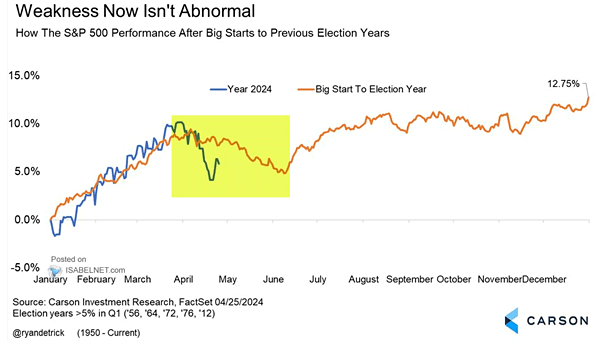
How the S&P 500 Performance After Big Starts to Previous Election Years After a strong start to the election year, the U.S. stock market tends to regain momentum towards the end of Q2 and generally…

U.S. Treasury Price vs. 200-Day Moving Average Should investors continue shorting U.S. bonds until bond yields exceed 5%? Image: BofA Global Investment Strategy
Weekly U.S. Equity Fund Flows Investors’ optimism and appetite for potential returns in the U.S. stock market resulted in inflows of $3.57 billion into U.S. equity funds over the past week Image: BofA Global Research
U.S. 10-Year Treasury Yield Since 1790 The trajectory and duration of the U.S. bond bear market can be influenced by factors such as inflation, economic growth, and the Federal Reserve’s monetary policy. Image: BofA Global…
Flows to Japan Equities Japan equity funds saw their largest inflow since May 2013 highlighting the potential for strong returns in the Japanese equity market. Image: BofA Global Investment Strategy
Fear & Greed Index – Investor Sentiment With a reading of 42 on the Fear & Greed Index, it suggests a fear level of market sentiment, indicating cautious investor behavior and a potential decrease in…
Housing – Global House Prices With a year-over-year increase of 6.6%, U.S. house prices are posing a greater challenge for prospective homebuyers in their pursuit of purchasing a home. Image: BofA Global Investment Strategy
Atlanta Fed GDPNow U.S. Real GDP Estimate The GDPNow model estimate for U.S. real GDP growth is 3.9% for 2024:Q2, suggesting that the U.S. economy is poised to experience a significant expansion. Image: Federal Reserve…
U.S. Core PCE Inflation For the past three months, U.S. core PCE inflation, the Federal Reserve’s favored gauge of inflation, has consistently exceeded the 2% target. Image: BofA Global Research