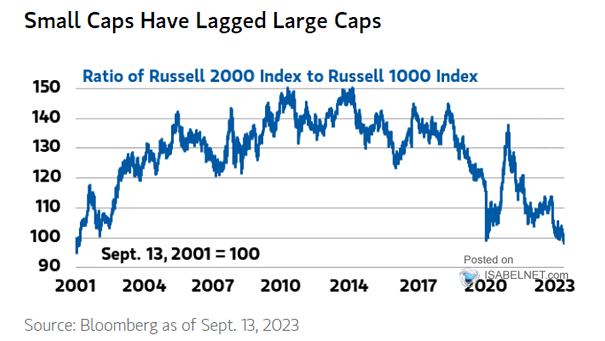
Performance – Ratio of Russell 2000 Index to Russell 1000 Index
Performance – Ratio of Russell 2000 Index to Russell 1000 Index The underperformance of small caps relative to large caps raises questions about their capacity to adapt to rapid changes in the economic landscape. Image: Morgan Stanley Wealth Management