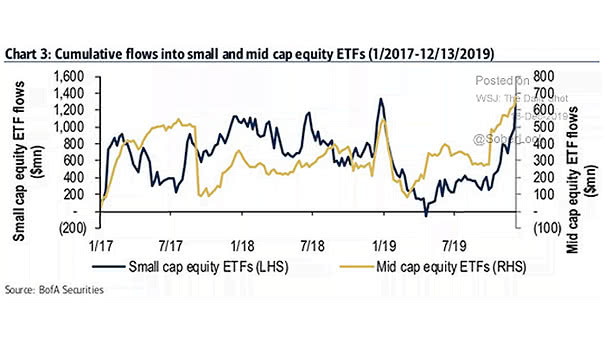
Cumulative Flows into Small and Mid Cap Equity ETFs
Cumulative Flows into Small and Mid Cap Equity ETFs Chart showing robust inflows into small and mid-cap ETFs this year. Image: BofA Securities
Cumulative Flows into Small and Mid Cap Equity ETFs Chart showing robust inflows into small and mid-cap ETFs this year. Image: BofA Securities
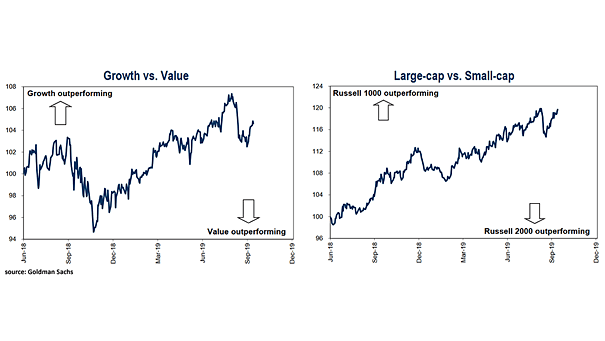
Growth Stocks vs. Value Stocks and Large-Cap vs. Small-Cap Around first rate cut, when growth stocks and large-cap stocks outperform, it does not suggest a recession is coming. Image: Goldman Sachs Global Investment Research

Number of Small-Cap M&A Deals At 10-Year High The number of small-cap deals is expected to continue to grow, because CEOs are under pressure to increase profits Image: Legg Mason
Relative Performance of the Equal-Weighted S&P 500 vs. Cap-Weighted S&P 500 by Macro Regimes The equal-weighted S&P 500 historically tends to outperform the cap-weighted index in economic recoveries, suggesting potential stronger growth for smaller and mid-cap companies compared to larger ones. Image: BofA US Equity & Quant Strategy
Net Retail Investment Flow as a % of Aggregate Market Capitalization Aggregate small-cap outflows by retail investors have been significant compared to their aggregate market capitalization. Image: Goldman Sachs Global Investment Research
Labor Market – NFIB Small Business Jobs Hard to Fill and U.S. Unemployment Rate Are extra unemployment benefits the reason hiring is so hard right now? Image: Capital Economics
Apple Market Capitalization vs. Russell 2000 This charts shows how big Apple is compared to U.S. small cap stocks. Image: Societe Generale Cross Asset Research
Zombies Walking Amongst the Smallest Companies Interesting chart showing the rise of zombie companies and their market capitalization. Image: Arbor Research & Trading LLC
Performance – Russell 2000 vs. S&P 500 Seasonality Small caps historically tend to outperform the S&P 500 from December to February. Allocating a portion of the portfolio to small cap stocks during this time may benefit investors. Image: Goldman Sachs Global Investment Research
S&P 500 Earnings Revisions Breadth Earnings revisions breadth for both large and small caps has returned to negative territory, which means that the overall sentiment and expectations for future earnings have worsened. Image: Morgan Stanley Research