Debt, Demographics and Labor Force Growth

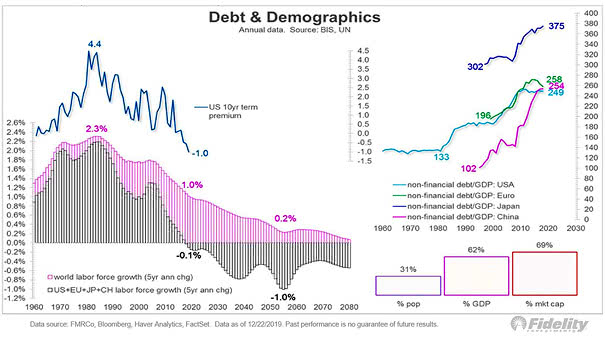
Debt, Demographics and Labor Force Growth The slowdown in the labor force in the U.S., China, Europe and Japan, represents 62% of the world’s GDP and 69% of the equity market capitalization. The labor force growth is expected to be -1% by 2055. Image: Fidelity Investments
Correlation of VIX with U.S. 10-Year TIPS Yields

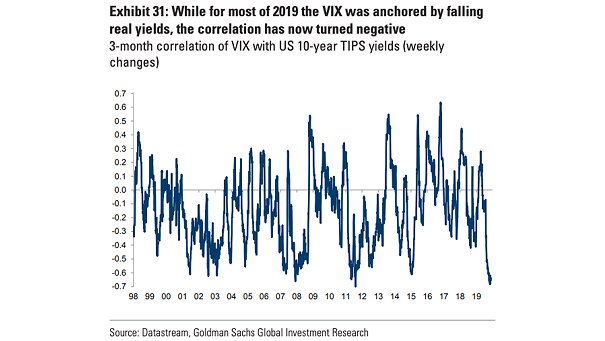
Correlation of VIX with U.S. 10-Year TIPS Yields The correlation of the VIX with U.S. 10-year TIPS yields has turned negative, as it was during the dot-com bubble burst, the Great Financial Crisis, the European debt crisis,… Image: Goldman Sachs Global Investment Research

Fears of Global Recession

Fears of Global Recession The latest BofAML’s European credit investor survey shows that fears of global recession have risen to 42%. Image: BofA Merrill Lynch

NFIB Survey Leads U.S. Employment

NFIB Survey Leads U.S. Employment The U.S. economy is not unaffected by the trade war and global slowdown. This chart suggests that U.S. employment is slowing down. The chart also suggests that the NFIB survey leads U.S. employment by 6 months. Image: Rothschild & Co Asset Management Europe

Dividend Yield vs. Corporate Bond Yield

Dividend Yield vs. Corporate Bond Yield This chart shows that dividend yields of European companies appear more attractive than corporate bond yields. Image: Goldman Sachs Global Investment Research

How “NO-DEAL Brexit” Would Affect the World’s Economy?

How “NO-DEAL Brexit” Would Affect the World’s Economy? What could a no-deal Brexit mean for developing countries? Main losers if there is a no-deal Brexit: European Union and Turkey. Main winners if there is a no-deal Brexit: China, USA, Japan, Thailand, South Africa, India, Brazil. Image: howmuch.net, UNCTAD

Earnings Matter, Over the Long Run

Earnings Matter, Over the Long Run Over the long run, equities move with earnings. Currently, there is a big gap between U.S. and Europe earnings. As Warren Buffett said: “for 240 years, it’s been a terrible mistake to bet against America.” You may also like “Global Earnings since 2006.” Image: Cullen Roche

Global Earnings since 2006

Global Earnings since 2006 This chart shows global earnings since 2006 (USA, Emerging Markets, Japan and Europe). As Warren Buffett said: “for 240 years, it’s been a terrible mistake to bet against America.” This chart below illustrates it well since 2006. You may also like “Earnings Matter, Over the Long Run.” Source: J.P. Morgan Asset Management

S&P 500 Cash Return Yield by Sector and Region

S&P 500 Cash Return Yield by Sector and Region Currently, the S&P 500 cash return yield (buybacks + dividends) is 5.2%, the highest since 2011. That’s much more than Europe, Japan and emerging markets. Image: Fundstrat Global Advisors, LLC