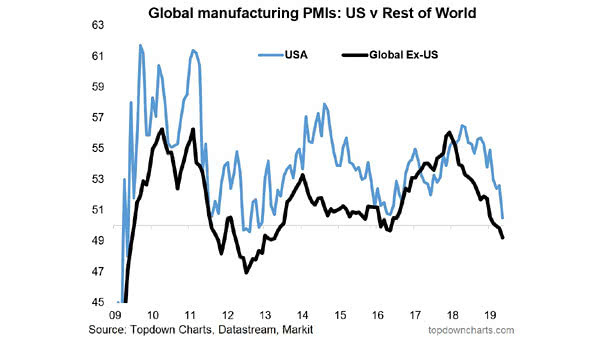
Global Manufacturing PMIs – USA vs. Rest of the World
Global Manufacturing PMIs – USA vs. Rest of the World Global ex-US manufacturing PMI is below 50 (contraction). We will see if the United States can go it alone in the coming months. You may also like “ISM Manufacturing Index vs. S&P 500 Index since 2011“ Image: Topdown Charts