ISM PMI and S&P 500
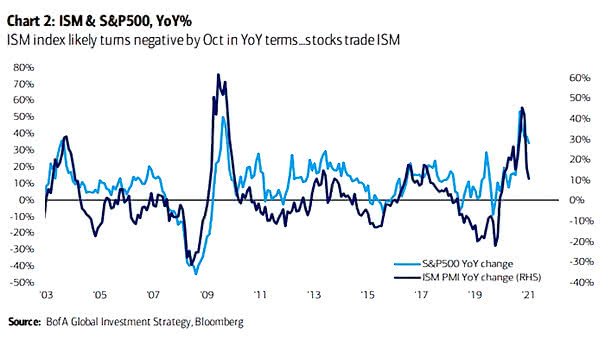
ISM PMI and S&P 500 What does a cooling in U.S. manufacturing growth mean for the S&P 500 in the coming months? Image: BofA Global Research
ISM PMI and S&P 500 What does a cooling in U.S. manufacturing growth mean for the S&P 500 in the coming months? Image: BofA Global Research
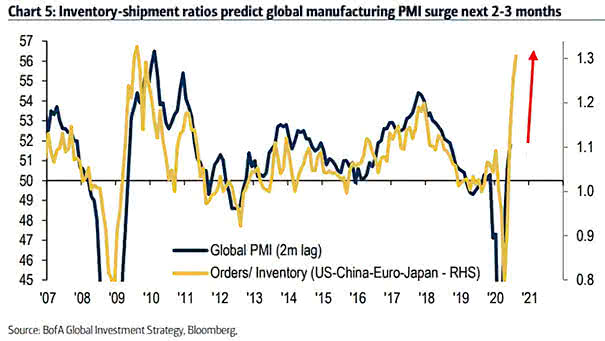
Global PMI vs. Orders/Inventory Ratio (Leading Indicator) Inventory-shipment ratios suggest a surge in the global manufacturing PMI over the next 2-3 months. Image: BofA Global Investment Strategy

Philly Fed Manufacturing Index and Empire State Manufacturing Survey and ISM Manufacturing Index Despite the coronavirus, both regional PMIs suggest an increase in U.S. ISM manufacturing this month. Image: Swedbank Research
ISM Manufacturing Index vs. ISM Non-Manufacturing Index The ISM Non-Manufacturing Index increased to 55.5% in January and suggests faster expansion in January than in December. Image: Oxford Economics
Yield Curve 10Y-2Y and U.S. ISM Manufacturing Index Chart suggesting that the U.S. 2+10Y bond yield YoY (inverted) tends to lead the U.S. ISM Manufacturing Index (YoY) by 18 months. U.S. PMI could bounce back in 2020. Image: Nordea and Macrobond
200D Change in Yield Curve 30Y-10Y Leads U.S. ISM Manufacturing Index This great chart suggests that 200-Day Change in Yield Curve 30-Year minus 10-Year spread leads U.S. ISM Manufacturing Index by 16 months. It also suggests that U.S. PMI is probably bottoming now and could bounce back. Image: Fundstrat Global Advisors, LLC
ISM Non-Manufacturing Index vs. U.S. GDP The chart shows the good correlation between ISM Non-Manufacturing PMI and U.S. GDP. Image: Piper Jaffray
ISM Manufacturing Index and U.S. 10-Year Treasury Bond Yield The decline in U.S. 10-year Treasury bond yields has been in line with falling ISM PMI. Picture Source: Deutsche Bank
ISM Manufacturing vs. 10-Year Treasury Yields This chart shows a nice correlation between ISM manufacturing index and 10-year Treasury yields since 2010. This chart can explain why 10-year Treasury yields have fallen. PMI index above 50 percent indicates that the manufacturing economy is expanding, and a PMI index below 50 percent indicates that the manufacturing…