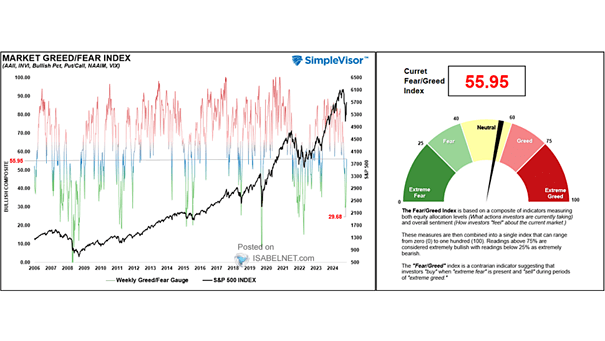
Performance – Theorical Growth of $100 Invested in Each Strategy
Performance – Theorical Growth of $100 Invested in Each Strategy Will U.S. small-cap value continue to outperform over the long term? Image: BofA Research Investment Committee
Russell 2000 Value/Growth Relative Returns Should investors favor small-cap value stocks over small-cap growth stocks? Image: BofA Research Investment Committee
Performance – Russell 2000 Relative to Nasdaq 100 vs. U.S. 10-Year Treasury Yield Will small-cap stocks continue to outperform large-cap growth stocks, if the U.S. 10-year Treasury yield continues to rise? Image: Lohman Econometrics
Russell 2000 Index – Members Above 200-Day Moving Average Are investors too optimistic, as small-cap breadth is reaching overbought levels? Image: Morgan Stanley Wealth Management
Performance – S&P 500 Completion Index vs. S&P 500 Index The S&P 500 Completion Index, which tracks U.S. mid, small, and micro-cap stocks not included in the S&P 500 Index, has outperformed YTD, thanks to Tesla. Image: The Wall Street Journal
Year-to-Date Performance – S&P 500 vs. Russell 2000 The Russell 2000 index has lagged the S&P 500 year-to-date, as many small-cap stocks are missing the party. Image: Financial Times
Economic Impact of U.S. Recessions This chart shows that the economic impact of most U.S. recessions is relatively small. The average expansion increased GDP by +24% vs. S&P 500 +117%, and the average recession reduced GDP by less than 2% vs. S&P 500 +3%. The average expansion is 67 months and the average recession is…