S&P 500 Advance-Decline Line

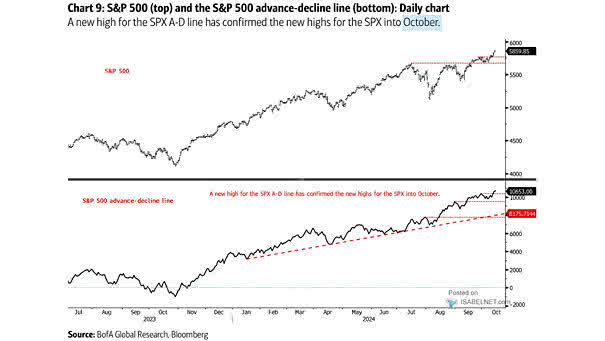
S&P 500 Advance-Decline Line The S&P 500 advance-decline line serves as an essential indicator of market trends and sentiment. When it hits an all-time high, it typically signals positive news for the U.S. stock market. Image: BofA Global Research

S&P 500 Daily Chart

S&P 500 Daily Chart The cup and handle breakout suggests a bullish trend, implying that the S&P 500 index could experience upward movement, with target levels of 5930 and 6180. Image: BofA Global Research

Performance – U.S. Small Cap Stocks vs. Large Cap Stocks

Performance – U.S. Small Cap Stocks vs. Large Cap Stocks Small caps continue to face significant challenges relative to large caps, a trend that has persisted for several years. However, there is a growing sense of cautious optimism about their potential recovery as market conditions change. Image: BofA Global Research

Corporate Client Buybacks as a % of S&P 500 Market Capitalization

Corporate Client Buybacks as a % of S&P 500 Market Capitalization BofA’s corporate clients are currently engaging in significant stock buyback activities, marking an all-time high. This trend is generally perceived as a positive indicator for the broader market. Image: BofA Securities

U.S. Money Market Fund Assets vs. Federal Funds Effective Rate

U.S. Money Market Fund Assets vs. Federal Funds Effective Rate U.S. money market funds are sensitive to changes in interest rates, and historical trends indicate that they often experience outflows approximately 12 months after an initial Fed rate cut. Image: Real Investment Advice

S&P 500 Monthly Returns and Percentage of Time Up – Presidential Cycle Year 4

S&P 500 Monthly Returns and Percentage of Time Up – Presidential Cycle Year 4 Seasonality provides valuable insights into stock market trends. Historically, after experiencing weaknesses in September and October during election years, the S&P 500 tends to rebound with strong returns in November and December. Image: BofA Global Research

S&P 500 Returns After Five Month Win Streaks

S&P 500 Returns After Five Month Win Streaks Historically, the S&P 500 has shown bullish trends in the 12 months following five-month winning streaks, with an average increase of 10.6% in value observed since 1950. Image: Carson Investment Research

S&P 500 Index and Fed Funds Effective Rate

S&P 500 Index and Fed Funds Effective Rate While Fed rate cuts typically provide a short-term boost to market sentiment, historical trends suggest they often coincide with economic slowdowns. Image: Real Investment Advice

Average Gold Returns After Trading Certain Distances from 200-Day Moving Average

Average Gold Returns After Trading Certain Distances from 200-Day Moving Average Gold is currently 15% above the 200-day moving average, suggesting short-term bullish sentiment. However, historical trends indicate that investors should brace for potentially flat returns in the following 1 to 6 months after such extremes. Image: BofA Global Research

% of Days per Year to Make a New All-Time High for the S&P 500

% of Days per Year to Make a New All-Time High for the S&P 500 The S&P 500’s performance this year reflects a strong bullish trend, with over one-fifth of trading days achieving new all-time highs, underscoring a favorable market environment. Image: Carson Investment Research

S&P 500 Down >4% Then Up >4% on Consecutive Weeks

S&P 500 Down >4% Then Up >4% on Consecutive Weeks When the S&P 500 experiences a drop of more than 4% in one week followed by a rise of more than 4% the next week, historical data indicates a bullish trend over the next 12 months, with a median gain of 18.8% since 1950. Image:…