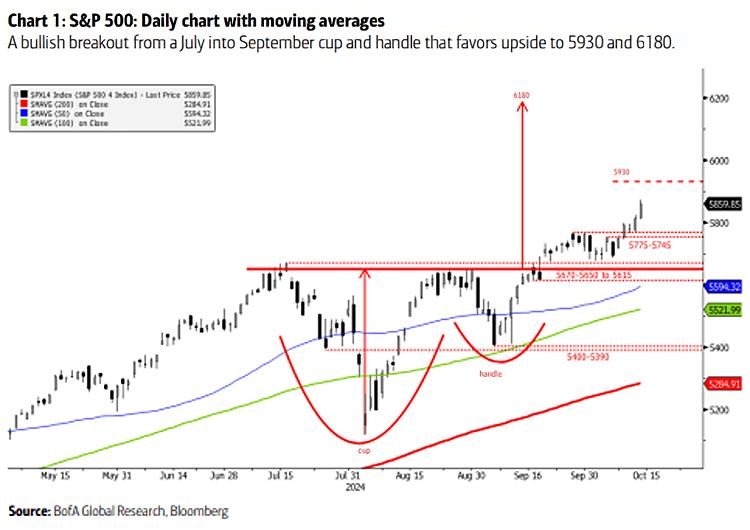
Oct 16 2024 Off S&P 500 Daily Chart The cup and handle breakout suggests a bullish trend, implying that the S&P 500 index could experience upward movement, with target levels of 5930 and 6180.Image: BofA Global Research