S&P 500 Pullbacks During Year Two of Bull Markets
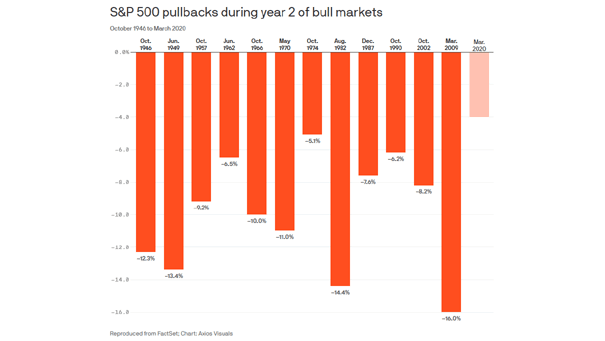
S&P 500 Pullbacks During Year Two of Bull Markets Should investors wait for a pullback as an opportunity to invest in U.S. stocks? Image: Axios
S&P 500 Pullbacks During Year Two of Bull Markets Should investors wait for a pullback as an opportunity to invest in U.S. stocks? Image: Axios
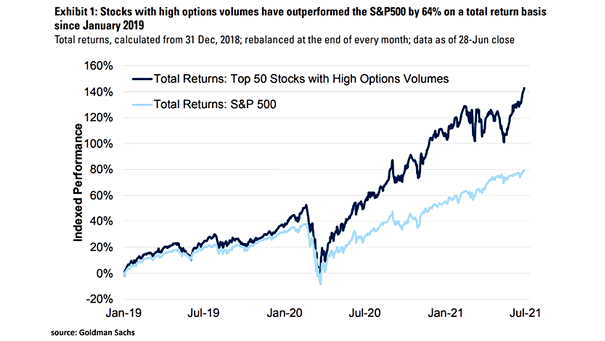
Performance – Top 50 Stocks with High Options Volumes vs. S&P 500 Since 2019, stocks with high options volumes have beaten the S&P 500 by a large margin. Image: Goldman Sachs Global Investment Research

S&P 500 Earnings Surprise Current estimates are forecasting an earnings surprise of 14.6% for the S&P 500, well above the long-run average of 7%. Image: J.P. Morgan Asset Management
SPY S&P 500 ETF – Day vs. Night Price Returns The S&P 500 loves the night. Since 1993, the real profits have been made outside regular trading hours. Image: Lohman Econometrics
ISM PMI vs. S&P 500 Markets tend to lead the macro for most time periods. Image: BofA Global Investment Strategy
% of Stocks Above 50-Day Moving Average When S&P 500 At Record Narrow breadth in S&P 500 could suggest below average market returns. Image: Bloomberg
S&P 500 – Quantity-On-Loan on the SPY U.S. ETF This short interest proxy on SPY US ETF has increased significantly since the FOMC meeting. Image: J.P. Morgan
S&P 500 Payout Ratio The S&P 500 payout ratio has gradually declined over time, as S&P 500 companies turn to buybacks. Image: Goldman Sachs Global Investment Research
S&P 500 “Fair Values” According to ISM Levels If the ISM drops to 50 by the end of 2021, the “fair value” of the S&P 500 would be 3730. Image: Nordea and Macrobond
S&P 500 Index Performance After The First Fed Rate Hike Historically, the S&P 500 Index tends to do well after the first Fed rate hike. Image: LPL Research
S&P 500 Index – Equal Weight vs. Pure Value vs. Pure Growth Is the value trade far from over? Image: Morgan Stanley Wealth Management