S&P 500 Price Return vs. 2021 EPS Revisions
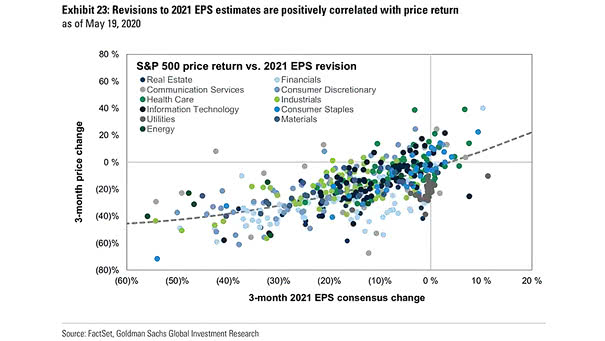
S&P 500 Price Return vs. 2021 EPS Revisions This chart highlights the positive correlation between price return and 2021 earnings revisions. Image: Goldman Sachs Global Investment Research
S&P 500 Price Return vs. 2021 EPS Revisions This chart highlights the positive correlation between price return and 2021 earnings revisions. Image: Goldman Sachs Global Investment Research
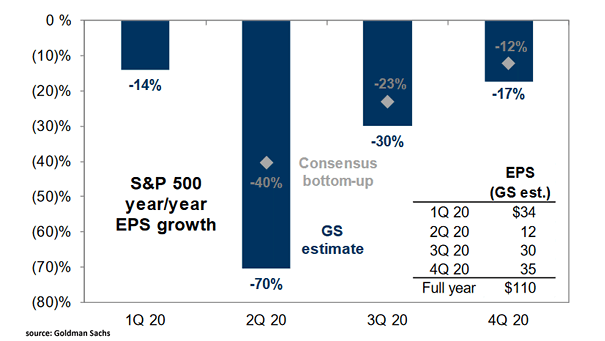
S&P 500 Year/Year EPS Growth Goldman Sachs maintains the 2020 S&P 500 EPS estimate of $110 and adjusts the quarterly path of earnings growth. Image: Goldman Sachs Global Investment Research

S&P 500 Current P/E Valuation Based on 2021 EPS Scenarios Goldman Sachs baseline forecast for S&P 500 earnings in 2021 is $170, and the downside forecast is $115. Today, the S&P 500 trades at 19.5x the buy-side estimate of EPS. Image: Goldman Sachs Global Investment Research
S&P 500 Index vs. Reported EPS This chart shows the very high correlation between stock prices and earnings since 1871 (R² = 0.97) Image: Fidelity Investments
S&P 500 Index vs. Earnings per Share (EPS) Currently, the S&P 500 Index prices in a 15% decline in EPS. A decline of 33% from 2019 seems more appropriate, according to Goldman Sachs. Image: Jeroen Blokland
S&P 500 YoY EPS Growth Goldman Sachs now forecasts S&P 500 EPS of $110 this year. Image: Goldman Sachs Global Investment Research
Wicksell Spread and S&P 500 12-Month EPS Growth (Leading Indicator) This chart suggests that the Wicksell spread tends to lead the S&P 500 12-Month EPS growth by 3 months. Image: Pictet Asset Management
Trailing 12 Month EPS Growth: S&P 500 vs. MSCI AC World ex U.S. Chart suggesting that the “fundamental” advantage of U.S. stocks is diminishing. Image: Morgan Stanley Research
% of S&P 500 Companies Guiding Next-Quarter EPS above Consensus “33% of S&P 500 companies have provided 1Q 2020 guidance above consensus.” Image: Goldman Sachs Global Investment Research
S&P 500 Operating EPS vs. Normalized EPS The gap between operating and normalized EPS is the widest since Q3 2007 (the prior market peak). Image: BofA US Equity & Quant Strategy
Percentage of S&P 500 Companies Guiding EPS Higher/Lower This quarter, the percentage of S&P 500 companies revising EPS guidance lower, is much higher than in previous quarters. Image: J.P. Morgan