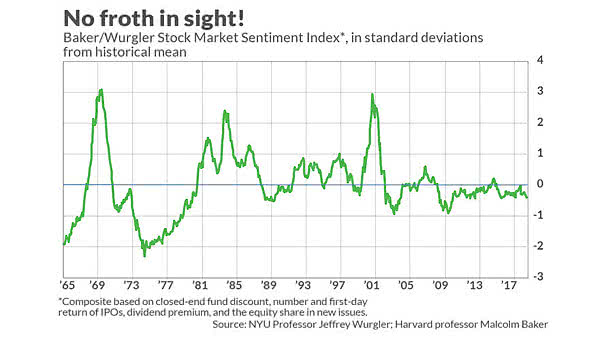
“U.S. Stock Market, No Froth In Sight” Says Stock Market Sentiment Index
“U.S. Stock Market, No Froth In Sight” Says Stock Market Sentiment Index Keep in mind that it is just another investor sentiment tool. But it does not show at all if the US stock market is overvalued or undervalued. See our stock market valuation model (99% correlation and R² = 0.97 since 1970).