S&P 500 Value Index at All-Time High
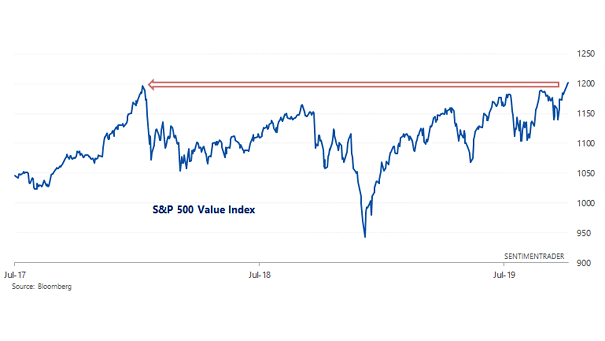
S&P 500 Value Index at All-Time High Historically, when the S&P 500 Value Index made a new all-time high for the first time in 200+ days, it went higher 6 months later. Image: Sentimentrader
S&P 500 Value Index at All-Time High Historically, when the S&P 500 Value Index made a new all-time high for the first time in 200+ days, it went higher 6 months later. Image: Sentimentrader
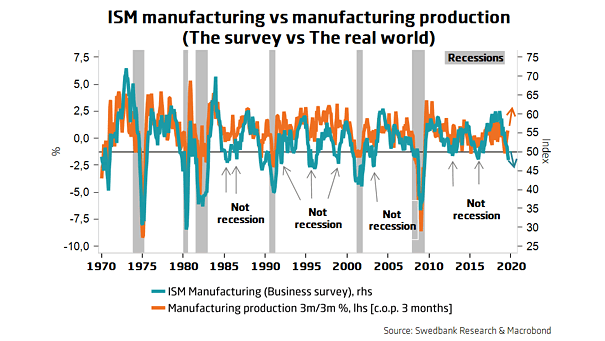
U.S. ISM Manufacturing Index vs. Manufacturing Production This chart shows the ISM survey (sentiment) versus the real world (hard data) and suggests it is not yet catastrophic. Image: Swedbank Research

S&P 500 After Official Presidential Impeachment Inquiry Chart showing that two presidential impeachment inquiries had two different results. Image: Sentimentrader
Fed Dovish Pivot – Stimulus Hopes Support Risk Appetite Growth sentiment appears to be stabilizing, due to optimism about fiscal policy. Image: Goldman Sachs Global Investment Research
Survey: What Is The Most Effective Risk-Off Hedge? In the latest BofA Merrill Lynch edition of the FX and rates sentiment survey, a majority of respondents preferred 10-year Treasuries as the most effective risk-off hedge. Only 6% of respondents chose gold and the yen. Image: BofA Merrill Lynch
S&P 500 and Hedge Fund Exposure While the S&P 500 is at all-time high, hedge funds increase their exposure to equities (last = 0.52). Image: Sentimentrader
Consumer Confidence Spread and U.S. Jobless Claims Interesting chart showing a good correlation between the consumer confidence spread and jobless claims. As a reminder, the consumer confidence vs. sentiment spread always peaks and then declines before a recession. You may also like “Conference Board Consumer Confidence Index vs. University of Michigan Consumer Sentiment Index.” Image: Pictet…
AAII Survey Bullish Votes, Sentix Bullish Votes US Equities, vs. S&P 500 since 2017 Low AAII Sentiment Survey bullish votes of 24.71%, and low Sentix bullish votes for US equities of 12.84%, have corresponded with positive forward returns. Image: Sentix, Bloomberg Finance L.P.
S&P 500 Futures – Massive Pre-market Fear Since 1982 Since 1982, there have been two time periods of this massive pre-market fear: in 2002 and 2008, during the bear market. Image: Sentimentrader
Investor Movement Index vs. S&P 500 The Investor Movement Index indicates the sentiment of TD Ameritrade retail investors. Thus, retail investors are net buyers of equities when the stock market is expensive, and they are net sellers of equities when the stock market is cheap. As usual, retail investors react to equity price movements. They buy and sell…
Can History Help Us Predict the Future of the S&P 500? When the S&P 500 hits all-time high and AAII Investor Sentiment Survey bulls is below 35%, then 88% of the time the S&P 500 is positive one year later (1986-2019). Image: SentimenTrader