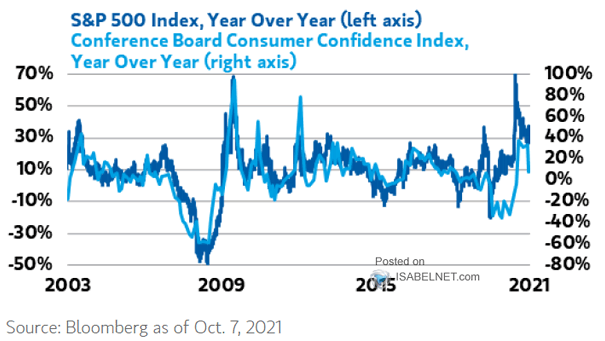
Bitcoin and Risk Appetite Indicator
Bitcoin and Risk Appetite Indicator Bitcoin and market sentiment tend to move in tandem. Image: Goldman Sachs Global Investment Research
S&P 500 and % of Members with MACD Sell Signals Is that bearish? 56% of S&P 500 stocks are sending sell signals. Image: SentimenTrader
Cross-Asset Volatility and Percentile of 3-Month Implied Volatility Cross-asset volatility is declining from very high levels, as sentiment has improved and new coronavirus cases have declined. Image: Goldman Sachs Global Investment Research
S&P 500 – Weekly Equity Fund Flow Unusual weekly equity fund outflows increase the likelihood of a positive return over the next 1 to 12 months. Image: Sentimentrader
S&P 500 and NYSE Down Volume Ratio Four of the past nine days have seen NYSE down volume ratio above 88%. Historically, the S&P 500 rallied every time over the next year, with a median return of 24.3% since 1962. Image: Sentimentrader
University of Michigan Stock Market Increase Probability Next Year and S&P 500 Drawdowns This chart suggests to remain vigilant on the U.S. stock market, when bullish sentiment is so high. Image: Bloomberg
Global Manufacturing PMI and U.S. 10-Year Treasury Yield Chart suggesting that improving global sentiment drives U.S. 10-year Treasury yields higher. Image: Nordea and Macrobond
S&P 500 and Fidelity 401(K) Millionaire Accounts The number of 401(k) millionaires hits record high at the end of the third quarter, while the average 401(k) balance is still only $105,200. Image: Sentimentrader
Gold and U.S. 10-Year Treasury Yield Risk sentiment in the market has improved and investors shift away from gold, while U.S. equities have reached new all-time highs. Image: U.S. Global Investors
Survey: US-China Trade Agreements About the “phase one deal”, the latest BofA Merrill Lynch edition of the FX and rates sentiment survey shows that 65% of fund managers see a skinny agreement, delaying some tariff increases. Image: BofA Merrill Lynch
S&P 500 Value Index at All-Time High Historically, when the S&P 500 Value Index made a new all-time high for the first time in 200+ days, it went higher 6 months later. Image: Sentimentrader