S&P 500 – Performance since 2016 vs. Performance since 2019
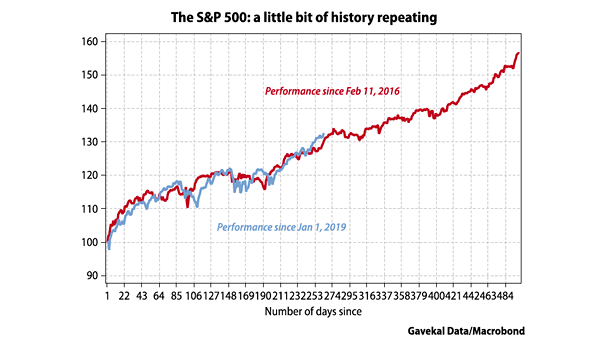
S&P 500 – Performance since 2016 vs. Performance since 2019 The U.S. stock market is on fire. Will history repeat itself? Image: Gavekal, Macrobond
S&P 500 – Performance since 2016 vs. Performance since 2019 The U.S. stock market is on fire. Will history repeat itself? Image: Gavekal, Macrobond
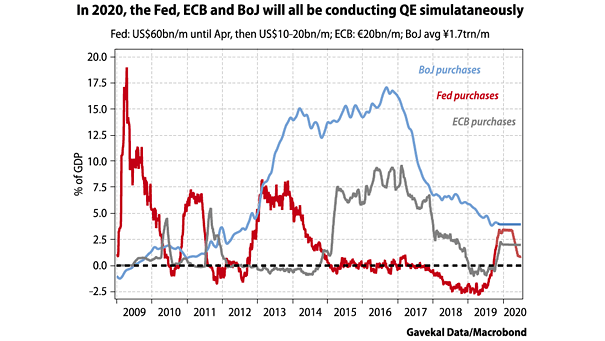
QE in 2020 and Central Banks (the Fed, ECB and BoJ) Central banks’ QE should support financial markets next year. Image: Gavekal, Macrobond

Buybacks – Cumulative Net Buying of U.S. Corporate Equity This chart shows that since 2009, buybacks have been the source of the rally in the U.S. stock market. Image: Oxford Economics, Macrobond
Trade War and Financial Conditions Index The trade war has tightened the Goldman Sachs FCI by about 60bp cumulatively. The Goldman Sachs Financial Conditions Index (FCI) is a weighted sum of a long-term corporate yield, a short-term bond yield, the exchange rate, and a stock market variable. Image: Goldman Sachs Global Investment Research
U.S. GDP and S&P 500 This interesting chart puts market corrections and U.S. GDP in perspective. Image: Oxford Economics, Macrobond
MOVE vs. Treasury Term Premium This chart shows the nice correlation between MOVE (implied volatility of U.S. Treasury markets) and the Treasury term premium. The term premium is the risk premium (or the bonus) that investors receive for the risk of owning longer-term bonds. Image: Longview Economics, Macrobond
U.S. Dollar and Relative Growth (GDP Spread) The chart shows that the U.S. Dollar REER is about relative growth (U.S. GDP – Other Developed Market GDP YoY). You may also like “U.S. Twin Deficits (% of GDP) Lead Real Trade Weighted Dollar Index by Two Years” and “U.S. Twin Deficits (% of GDP) Lead U.S.…
Fed Monetary Policy Rate Change over 6 Months Prices in (Futures) vs. Actual Actually, the Fed decides when to raise rates, but the market decides when to cut rates. This chart shows that rate expectations are highly predictive six months in advance. You may also like “Markets Have Accurately Priced in Cuts before Easing Cycles…