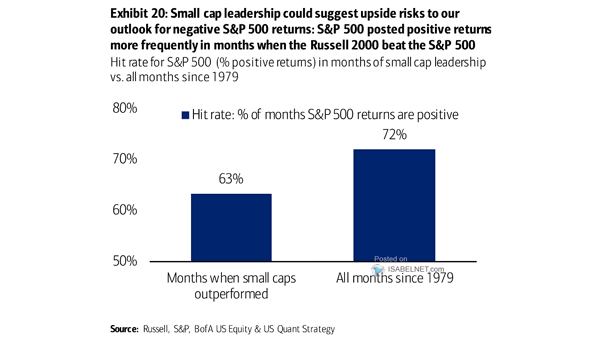
S&P 500 Energy Sector Index vs. S&P 500 Composite Index

S&P 500 Energy Sector Index vs. S&P 500 Composite Index The lost decade for the S&P 500 energy sector. It has gained only 6% over the past 10 years, compared to 189% for the S&P 500 Composite Index. Image: Lewis Krauskopf

S&P 500 Percentage of Up Days by Year

S&P 500 Percentage of Up Days by Year This year, the S&P 500 recorded gains 59.3% of the time. This has been rare since 1928. Image: Bespoke Investment Group

S&P 500 Average Returns Since 1926

S&P 500 Average Returns Since 1926 Historically, in the year following a double-digit gain, there have only been three years where the U.S. stock market has experienced a double-digit decline. Image: Ben Carlson

S&P 500 Levels, Bank Projections

S&P 500 Levels, Bank Projections Morgan Stanley is a bear, but Wall Street expects gains for the S&P 500 in 2020 Image: Financial Times

U.S. Equity Flows and S&P 500

U.S. Equity Flows Chart showing that money is once again flowing slightly into equity funds and ETFs. Image: Fidelity Investments

2020 Forecasts for the S&P 500

2020 Forecasts for the S&P 500 Analysts are forecasting losses or moderate gains for the S&P 500 in 2020. Image: The Wall Street Journal

S&P 500 vs. MSCI Emerging Markets Index

S&P 500 vs. MSCI Emerging Markets Index This chart shows the strong performance of the S&P 500 against the MSCI Emerging Markets Index. Image: Financial Times