U.S. Corporate Profits vs. Assets

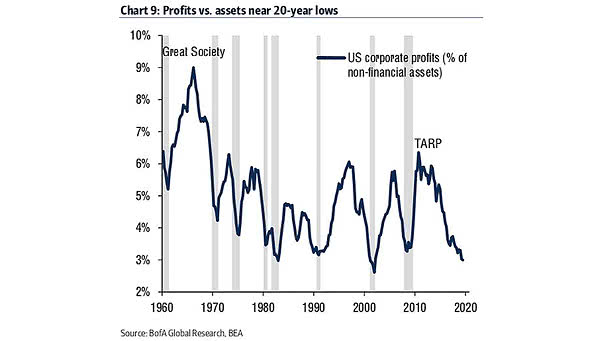
U.S. Corporate Profits vs. Assets U.S. corporate profits are near 20-year lows relative to fixed assets. The alternative to a recovery in corporate profits is the increasing risk of recession. Image: BofA Global Research
Number of Countries in Each Cycle Stage

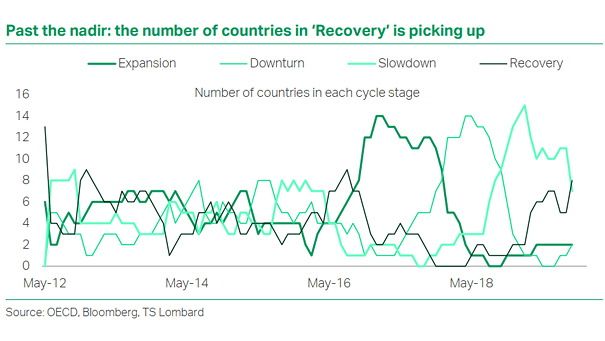
Number of Countries in Each Cycle Stage Chart suggesting that the global synchronised slowdown is over. According to the OECD leading indicators, the number of countries in recovery is rising. Image: TS Lombard

Asian Exports

Asian Exports There is a glimmer of hope of a recovery in Asian exports. The free fall in Japan, Taiwan and South Korea exports in early 2019 has stopped. Image: Danske Bank

Earnings Estimate Progression

Earnings Estimate Progression The consensus growth estimate for Q3 earnings stands at -3.2%, but the earnings recovery seems better than 2016. The Fed’s dovish pivot and low interest rates should continue to support the U.S. stock market. Image: Fidelity Investments

U.S. Excess Liquidity Growth Leads S&P 500 Returns

U.S. Excess Liquidity Growth Leads S&P 500 Returns This chart suggests that M2 money supply to nominal GDP ratio leads S&P 500 returns by one year. Is the S&P 500 vulnerable to a drop, followed by a recovery? Image: Oxford Economics, Macrobond