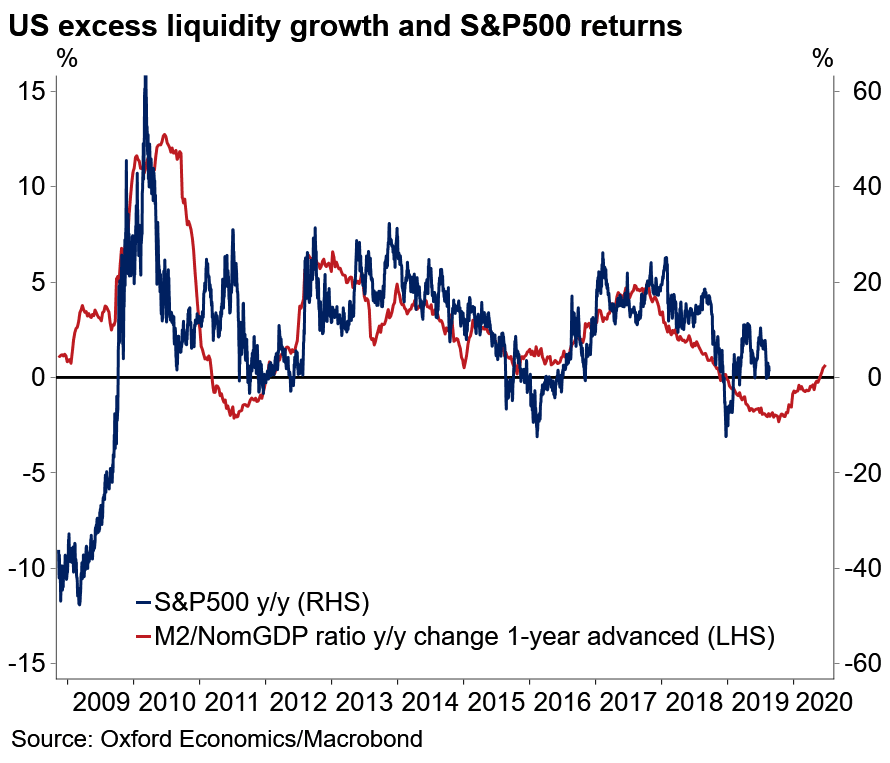
Aug 21 2019 Off U.S. Excess Liquidity Growth Leads S&P 500 Returns This chart suggests that M2 money supply to nominal GDP ratio leads S&P 500 returns by one year.Is the S&P 500 vulnerable to a drop, followed by a recovery?Image: Oxford Economics, Macrobond