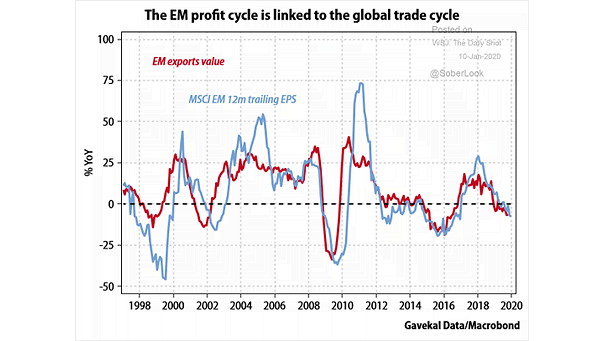
S&P 500 Operating EPS vs. Normalized EPS

S&P 500 Operating EPS vs. Normalized EPS The gap between operating and normalized EPS is the widest since Q3 2007 (the prior market peak). Image: BofA US Equity & Quant Strategy

U.S. Corporate Profits vs. S&P 500 EPS

U.S. Corporate Profits vs. S&P 500 EPS The current divergence between large-cap profits and the rest of the economy is the widest on record. It is possible to close the gap “down” (recession) or “up” (reflation). Image: BofA Global Research

STOXX Europe 600 EPS Revisions

STOXX Europe 600 EPS Revisions This year, SXXP EPS revisions have not been worse than a typical year. Image: Goldman Sachs Global Investment Research

MSCI U.S. EPS vs. Trend

MSCI U.S. EPS vs. Trend History shows that earnings well above the trend in the U.S. precede earning plunges. Image: Barclays Research

S&P 500 EPS Forecast

S&P 500 EPS Forecast Despite the earnings squeeze, Goldman Sachs is still positive on the S&P 500 earnings outlook. In 2020, U.S. and global growth should rebound modestly. Image: Goldman Sachs Global Investment Research

U.S. ISM Manufacturing Index and Cyclicals EPS Revision

U.S. ISM Manufacturing Index and Cyclicals EPS Revision This chart shows the correlation between the ISM Manufacturing Index and cyclicals EPS revision, suggesting that 4Q19 will see a reset, with capital goods pricing in an actual earnings recession. Image: Morgan Stanley Research

EPS Growth Over Time

EPS Growth Over Time This chart shows that negative EPS growth doesn’t always mean a recession is coming. Image: Goldman Sachs Global Investment Research