EPS Growth Over Time
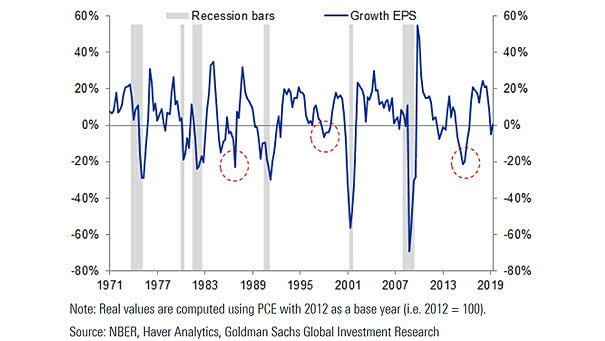
EPS Growth Over Time This chart shows that negative EPS growth doesn’t always mean a recession is coming. Image: Goldman Sachs Global Investment Research
EPS Growth Over Time This chart shows that negative EPS growth doesn’t always mean a recession is coming. Image: Goldman Sachs Global Investment Research
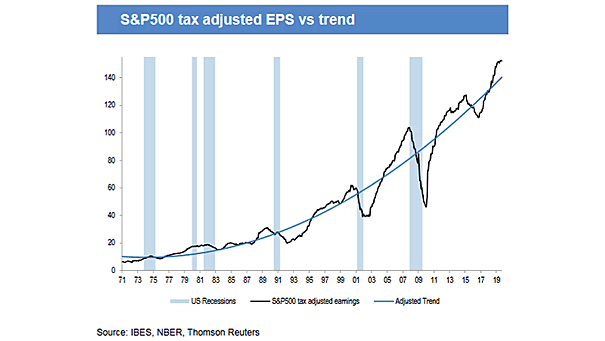
S&P 500 Tax Adjusted EPS vs. Trend Interesting chart showing that S&P 500 tax adjusted earnings are well above the trend in the United States, and have historically preceded earning plunges. Image: J.P. Morgan Asset Management

Buyback Contribution to EPS Growth Buybacks constitute a very important part of the earnings payout. Without them, there is no EPS growth. Image: Credit Suisse Research
S&P 500 vs. 12-Month Forward EPS Estimate Chart suggesting that the 52-week rate-of-change in forward EPS could turn negative. Image: Lohman Econometrics
S&P 500 EPS and South Korea Exports Chart showing the quite good correlation between S&P 500 EPS and South Korea exports, and suggesting this does not bode well for S&P 500 EPS. Image: Nordea and Macrobond
10Y-3M Yield Curve Inversion and S&P 500 Operating EPS The inversion of the yield curve between 3-month and 10-year Treasurys is not good news for S&P 500 operating EPS (90D means 3-month T-bill). The 50 day moving average removes false signals since 1967. Image: Stifel
S&P 500 Operating EPS vs. USA National Income, Corporate Profits Thanks to buybacks, this chart clearly shows the current divergence. Is a new bubble being formed? Image: Nordea and Macrobond
Japan Corporate Profits Leads MSCI World EPS This chart suggests that Japan corporate profits leads MSCI World EPS by 7 months. Image: Nordea and Macrobond
S&P 500 EPS vs. U.S. Nonfinancial Corporate Profits Creative accounting is imaginative ways to present accounts. The divergences between earnings and U.S. nonfinancial corporate profits occur before recessions. Image: Gavekal, Macrobond
S&P 500 Forward EPS and World Trade Growth The chart shows a pretty good correlation between the S&P 500 forward 12-month EPS and the CPB World Trade Index. Image: Oxford Economics, Macrobond
South Korean Exports vs. S&P 500 EPS Estimates The correlation between South Korean exports and S&P 500 EPS estimates suggests a weakness in S&P 500 earnings estimates. Image: Lohman Econometrics