Retail Trades and Individual Investors
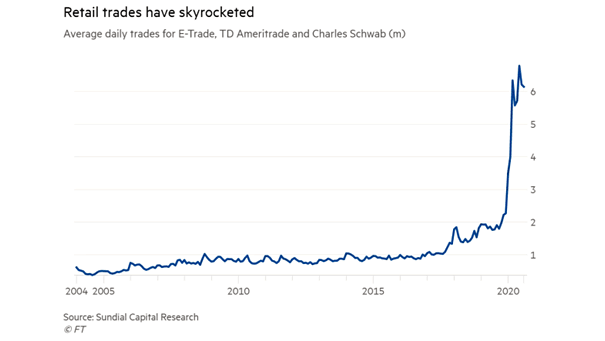
Retail Trades and Individual Investors Retail investors are driving the recent bull market. Image: Financial Times
Retail Trades and Individual Investors Retail investors are driving the recent bull market. Image: Financial Times
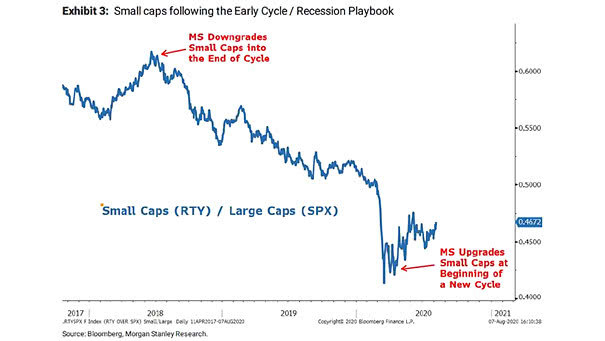
Stocks – Small Caps / Large Caps Since late March, the bull market has followed the typical recession playbook, with the Russell 2000 outperforming the S&P 500. Image: Morgan Stanley Research

Price Return Indexes – MSCI World ex-US and US Valueline Composite Index Where is the bull market exactly? Today, the Valueline composite index, considered as a proxy for the U.S. market’s performance, stands at the same level as in 1998. Image: Gavekal, Macrobond
Global Equities: % of Countries at Least 20% Higher than their 52-Week Low A new bull market in global equities? This chart suggests that 74% of countries are now in a “bull market”. Image: Topdown Charts
S&P 500 – Anatomy of a Decline Is this a new bull market? Not yet, although the S&P500 has gained 20% from the low of 2192. Image: Fidelity Investments
S&P 500 Forward Return and Two Consecutive 3% Declines This table suggests that the current sell-off is a correction in a bull market. Image: Fundstrat Global Advisors, LLC
S&P 500 Forward P/E Ratio S&P 500 to 3,550? “Bull markets don’t die of old age” but the forward P/E ratio of the S&P 500 remains at high level. Image: Truist
S&P 500 Index vs. MSCI EAFE Index Largely due to structural headwinds, international stocks have underperformed U.S. stocks significantly in this bull market, over the last ten years. It could continue next year as well. Image: LPL Research
Total Return since 2008: 60/40 Portfolio, S&P 500 and U.S. Treasury 20+ Year The current bull market began 10 years ago, but the next 10 years could be very different. Image: Financial Times
S&P 500 Index and UBS Weighted Global Growth Surprise Index The divergence between the S&P 500 Index and the global growth surprise index could explain why this bull market is so hated. Image: Swedbank Research
Dow Jones Transportation Average vs. S&P 500 This interesting chart suggests that the Dow Jones Transportation Average underperforms in secular bull markets. Actually, the S&P 500 had higher returns when the Dow Jones Transportation Average experienced negative momentum. Image: Oppenheimer & Co.