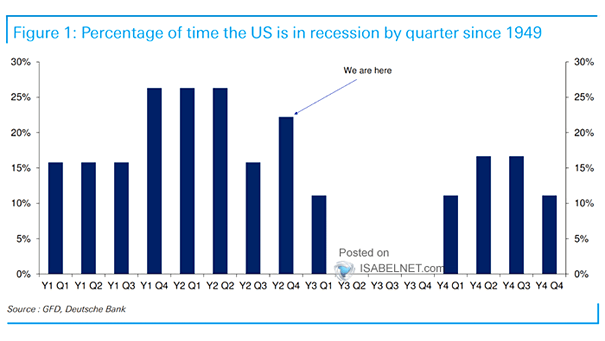
Percentage of Time the U.S. Is in Recession
Percentage of Time the U.S. Is in Recession Will the U.S. stock market rise in the 12 months following midterm elections, despite fears of a recession? Image: Deutsche Bank
Percentage of Time the U.S. Is in Recession Will the U.S. stock market rise in the 12 months following midterm elections, despite fears of a recession? Image: Deutsche Bank
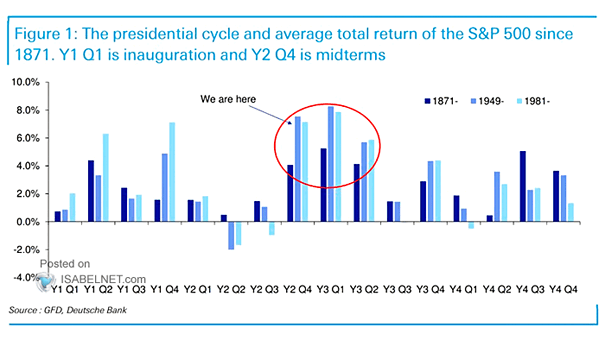
The Presidential Cycle and Average Total Return of the S&P 500 Should investors expect the S&P 500 to rise after midterm elections, despite macro headwinds? Image: Deutsche Bank

S&P 500 Index Monthly Performance in October In October, U.S. stocks tend to perform better in odd years than in even years, as odd years avoid elections and midterms. Image: LPL Research
Performance – S&P 500 vs. Basket of 30 Equities Expected to Benefit from a Biden Win Biden longs outperformed in the equity market, as investors are betting on a potential Biden election victory. Image: BofA Global Research
Impact of U.S. Corporate Tax Hike on S&P 500 This table suggests the impact on the S&P 500 if Joe Biden won the election and the Democrats swept both houses of Congress. Image: Societe Generale Cross Asset Research
S&P 500 Options – S&P 500 3325-Strike Put Implied Volatility S&P 500 options reflect the possibility that the U.S. election results may be finalized with a delay. Image: Goldman Sachs Global Investment Research
Investors and Average Cash Balance Cash is up 4.9% from 4.7%, as investors remain cautious on coronavirus, election and macro. Image: BofA Global Fund Manager Survey
The U.S. Presidential Cycle How U.S. presidential elections affect stock market returns? This chart shows the forward return for the U.S. stock market based on election outcomes. Image: Fidelity Investments
S&P 500 Forward P/E Forecast Goldman Sachs forecasts a forward P/E of 18.6 by year-end, and a downside scenario at 16, depending on tariffs and the US election result. Image: Goldman Sachs Global Investment Research
S&P 500 Forecast for 2020 Goldman Sachs forecasts a price-target for the S&P 500 at 3400 by year-end 2020, and a downside scenario at 2600 depending on tariffs and the US election result. Image: Goldman Sachs
Why Is the Dollar So Strong? There are several reasons for this: – Interest rates differential – Strong American economy and no immediate recession– American geopolitical dominance– Market shadow over Donald Trump’s re-election Image: The Daily Shot