FMS Investors – Global Emerging Markets
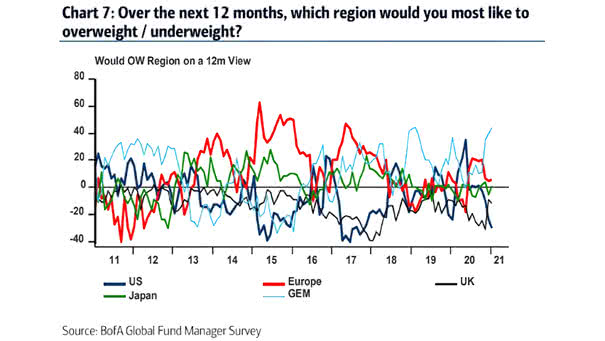
FMS Investors – Global Emerging Markets FMS investors expect to overweight global emerging markets over the next 12 months. Image: BofA Global Fund Manager Survey
FMS Investors – Global Emerging Markets FMS investors expect to overweight global emerging markets over the next 12 months. Image: BofA Global Fund Manager Survey
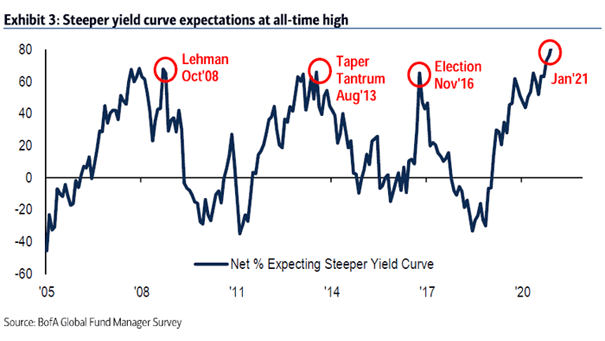
FMS Investors and Yield Curve Expectations 83% of FMS investors expects a steeper yield curve. This is an all-time high. Image: BofA Global Fund Manager Survey

FMS Investors – Early Cycle vs. Recession 70% of BofA FMS investors think the global economy is in an early-cycle phase. Image: BofA Global Fund Manager Survey
Cash – FMS Investors BofA FMS investors are underweight cash, suggesting an early-stage recovery as after the internet bubble and the Great Financial Crisis. Image: BofA Global Fund Manager Survey
FMS Investors and 10Y-3M Yield Curve FMS investors are expecting a steeper yield curve. At 73%, this is an all-time high. Image: BofA Global Fund Manager Survey
Performance – What Asset Class Do You Think Will Outperform in 2021? FMS investors expect emerging markets, the S&P 500 and oil to outperform in 2021. Image: BofA Global Fund Manager Survey
Sentiment – FMS Investor Optimism on Stocks Is it time to sell on vaccine news, as BofA suggests? Image: BofA Global Fund Manager Survey
FMS Investors – Net % Think Small Caps will Outperform Large Caps Historically, small caps tend to outperform large caps after recessions. Image: BofA Global Fund Manager Survey
Gold Price and Valuation FMS investors believe gold overvaluation has dropped. Image: BofA Global Fund Manager Survey
Institutional Fund % Cash and Retail Fund % Cash This month, retail funds reduced elevated cash levels to 4.3%. Image: BofA Global Fund Manager Survey
Valuation – Banks vs. Tech FMS investors say banks are undervalued vs. tech. Image: BofA Global Fund Manager Survey