S&P 500 Monthly Returns Since 1985
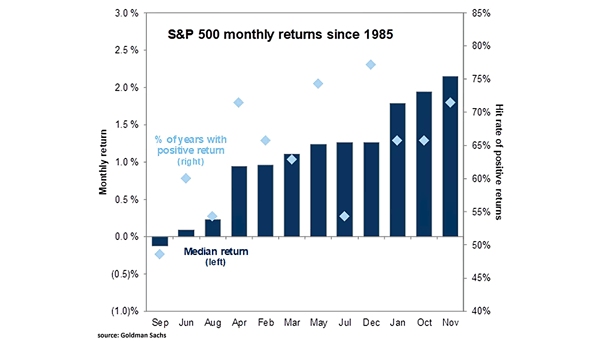
S&P 500 Monthly Returns Since 1985 More gains to come in Q4? Image: Goldman Sachs Global Investment Research
S&P 500 Monthly Returns Since 1985 More gains to come in Q4? Image: Goldman Sachs Global Investment Research
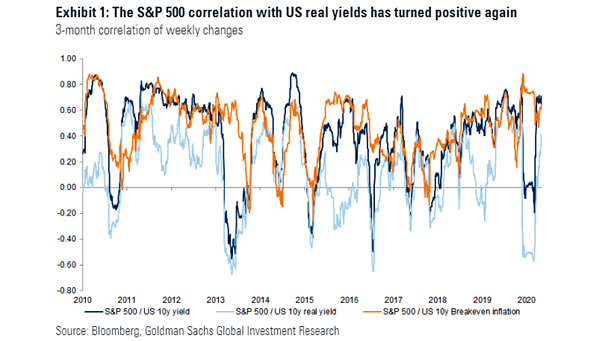
S&P 500 Correlation with U.S. Real Yield The correlation of the S&P 500 with real yields has been negative for most of this year, but it has turned positive again. Image: Goldman Sachs Global Investment Research

U.S. Small Caps – Ratio of Russell 2000 vs. S&P 500 Chart suggesting that small stocks are no longer providing big gains for investors Image: Financial Times
Performance – FANG+ Index vs. S&P 500 and U.S. Banks The FANG+ index climbs higher, while banks slump again over fears of job losses and bad loans. Image: J.P. Morgan
Gold vs. S&P 500 and Inflation Gold is considered to be a hedge against inflation and tends to outperform equities in environments when inflation gets above trend. Image: Goldman Sachs Global Investment Research
S&P 500 vs. 60/40 Portfolio Since 2020, the S&P 500 has delivered higher returns than the 60/40 portfolio but with greater volatility, while the 60/40 portfolio has provided more stability at the cost of lower overall gains. Image: Bloomberg
S&P 500 – Top Months Since World War II The S&P 500 posted its biggest one-month gain since 1987, surging 12.7% in April. Image: CNBC
S&P 500 and Best 15-Day Returns Ever Historically, the best 15-day returns ever have lead to strong returns over the next 12 months, with an average gain of 21.9%. Image: LPL Research
S&P 500 – Anatomy of a Decline Is this a new bull market? Not yet, although the S&P500 has gained 20% from the low of 2192. Image: Fidelity Investments
S&P 500 Performance When President Is Up For Reelection Since 1950, the S&P 500 has finished the year higher when a President has been up for reelection. Gains tend to occur in the second half of the year. Image: Ryan Detrick, LPL Financial LLC
S&P 500 Return in First Five Days vs. the Full Year Since 1950, when the stock market finished the first five days higher, the S&P 500 has been positive 82% of the time at year-end, with an average gain of 13.6%. Image: CNBC