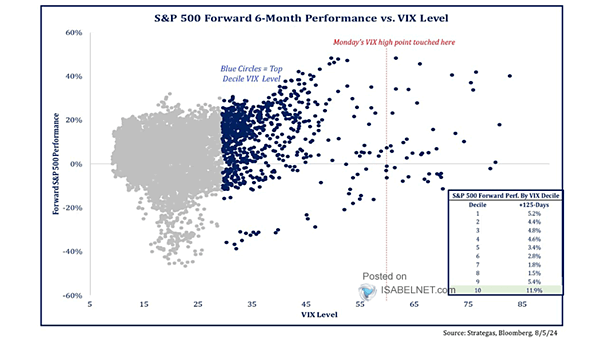
S&P 500 Forward 6-Month Performance vs. VIX Level
S&P 500 Forward 6-Month Performance vs. VIX Level Very high VIX readings may actually precede periods of strong market performance over the subsequent 6 months, as investor sentiment stabilizes and confidence returns. Image: Strategas Research Partners