S&P 500 and Peak in U.S. 2-Year Yields
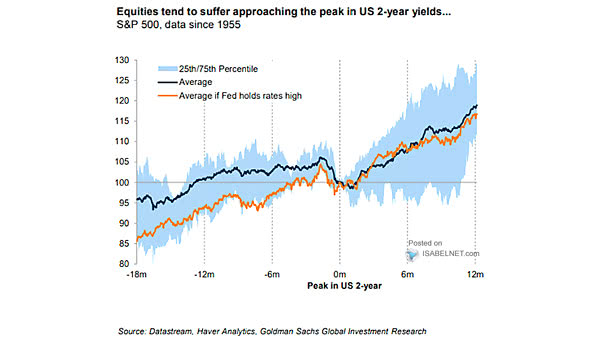
S&P 500 and Peak in U.S. 2-Year Yields Should investors expect the S&P 500 to rebound after the peak in U.S. 2-year yields? Image: Goldman Sachs Global Investment Research
S&P 500 and Peak in U.S. 2-Year Yields Should investors expect the S&P 500 to rebound after the peak in U.S. 2-year yields? Image: Goldman Sachs Global Investment Research
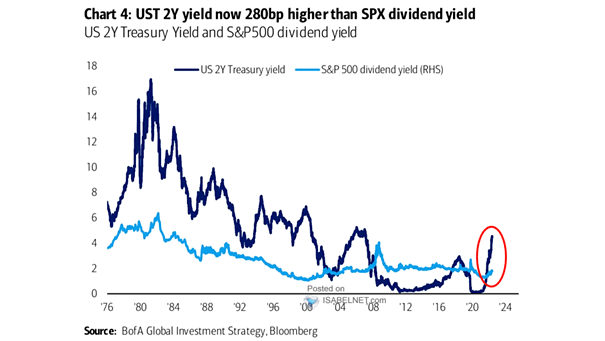
U.S. 2-Year Treasury Yield vs. S&P 500 Dividend Yield The U.S. 2-year Treasury yield looks attractive vs. the dividend yield of the S&P 500. Image: BofA Global Investment Strategy

S&P 500 Daily Returns vs. U.S. 2-Year Daily Changes Will the negative correlation between moves in the S&P 500 and moves in rates persist? Image: Goldman Sachs Global Investment Research
Yield Curve – U.S. 30-Year – 2-Year Government Bond Spread The 30Y-2Y inverted yield curve does not bode well for the U.S. economy. Image: The Daily Shot
U.S. 10-Year Yields and Peak in U.S. 2-Year Yields Will U.S. Treasury yields peak once the Fed finishes tightening? Image: Goldman Sachs Global Investment Research
U.S. Dollar and Peak in U.S. 2-Year Yields Will the U.S. dollar stay strong as long as the Fed remains hawkish? Image: Goldman Sachs Global Investment Research
Days from Peak in U.S. 2-Year Yield to End of Fed Hiking Cycles Will the U.S. 2-year Treasury yield peak before the end of the Fed’s hiking cycle? Image: Goldman Sachs Global Investment Research
Energy Crisis – Germany 2-Year Asset Swap Spreads Could the Germany energy crisis turn into a deep recession? Image: BofA Global Investment Strategy
Inflation – U.S. Headline CPI and 1-Year and 2-Year Breakevens Is the surge in U.S. inflation transitory? Image: Alpine Macro
U.S. 2-Year Treasury Yield vs. Fed Funds Historically, U.S. 2-year Treasury yields tend to lead Fed funds by 20 weeks. Image: Richardson Wealth
Inflation – 2-Year Change in Labor Participation Rate and 2-Year Change in CPI Growth Labor shortages contribute to inflation. Image: Alpine Macro