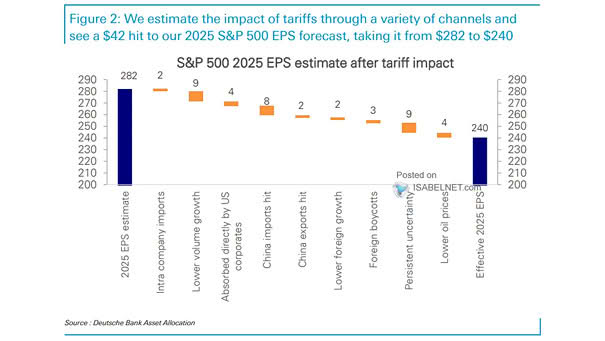
U.S. ISM Manufacturing Index vs. S&P 500 EPS Annual % Change

U.S. ISM Manufacturing Index vs. S&P 500 EPS Annual % Change With the ISM Manufacturing Index still in contraction territory and strongly correlated with S&P 500 earnings growth, questions arise about the resilience of corporate earnings in 2025. Image: Real Investment Advice

S&P 500 EPS and Long-Term Trend in Earnings

S&P 500 EPS and Long-Term Trend in Earnings The S&P 500’s earnings trend remains robust, with projections indicating continued growth near the upper limits of its long-term trend channel. Image: Deutsche Bank

S&P 500 EPS

S&P 500 EPS While the Magnificent 7 are still expected to report strong earnings growth, the anticipated narrowing of the gap with the S&P 493 suggests a potential shift towards more diversified market performance. Image: Goldman Sachs Global Investment Research

EPS Revisions

EPS Revisions While consensus estimates for 2025 S&P 500 EPS have reverted to modest downward revisions, the overall market sentiment remains cautiously optimistic, supported by improving economic indicators. Image: Goldman Sachs Global Investment Research

S&P 500 Level and EPS

S&P 500 Level and EPS Driven by expectations of robust earnings per share growth, Goldman Sachs has set its 12-month S&P 500 price target at 6,300. Image: Goldman Sachs Global Investment Research

S&P 500 Blended EPS

S&P 500 Blended EPS Analysts on Wall Street express optimism for the S&P 500 in 2025, forecasting 14.8% earnings growth amid a favorable macroeconomic landscape. Image: Bloomberg

Difference Between Realized and Consensus Estimate of S&P 500 EPS

Difference Between Realized and Consensus Estimate of S&P 500 EPS While S&P 500 companies continue to beat EPS estimates, indicating underlying strength, recent data suggests this trend is moderating compared to previous quarters Image: Goldman Sachs Global Investment Research

S&P 500 EPS Estimates ex-Tech and Communications

S&P 500 EPS Estimates ex-Tech and Communications The S&P 500’s earnings growth is heavily dependent on the technology sector, highlighting the crucial role that tech companies play in driving overall corporate profits in the United States. Image: Bloomberg

S&P 500 EPS – Potential U.S. Tax Impact on Earnings Per Share

S&P 500 EPS – Potential U.S. Tax Impact on Earnings Per Share Donald Trump’s plan to cut the U.S. corporate tax rate from 21% to 15% could significantly impact S&P 500 earnings per share, potentially increasing EPS by 4% and improving profitability for many companies in the index. Image: BofA US Equity & Quant Strategy

S&P 500 EPS Growth

S&P 500 EPS Growth Consensus estimates suggest that 72% of S&P 500 companies are projected to report EPS growth in 3Q24, reflecting a broader trend of improving earnings outlooks across various sectors. Image: BofA US Equity & Quant Strategy

U.S. GDP vs. S&P 500 EPS

U.S. GDP vs. S&P 500 EPS U.S. GDP and S&P 500 EPS are significantly correlated. High valuations and optimistic earnings forecasts mean a GDP slowdown could greatly affect corporate earnings, highlighting the need for cautious investment strategies in the future. Image: Real Investment Advice