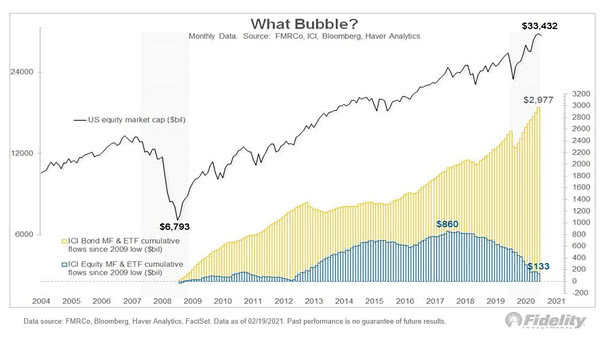
What Bubble? – Mutual Funds and ETF Cumulative Flows into Equities and Bonds Since 2009
What Bubble? – Mutual Funds and ETF Cumulative Flows into Equities and Bonds Since 2009 Are U.S. equities a long way away from being in bubble territory, as inflows since 2009 have gone into bonds, not equities? Image: Fidelity Investments