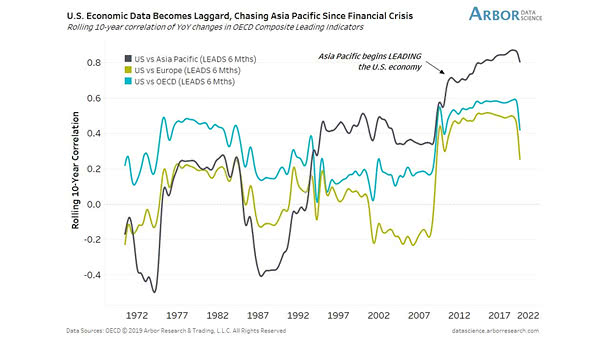
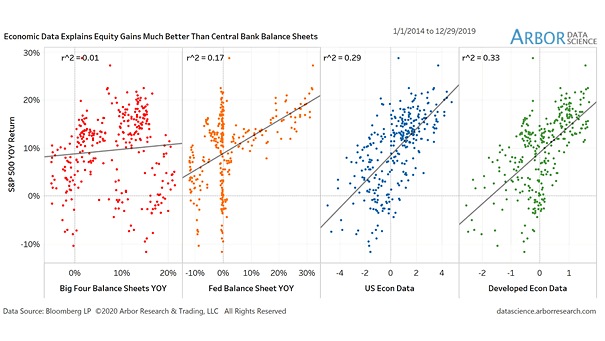
Asia Pacific Economic Data Leads the U.S. Economy

Asia Pacific Economic Data Leads the U.S. Economy This chart suggests that Asia Pacific economic data leads the U.S. economy since the Great Financial Crisis. U.S. economic data becomes laggard. Image: Arbor Research & Trading LLC

U.S. Economic Data

U.S. Economic Data Chart showing that U.S. economic data revisions have turned negative. Image: Arbor Research & Trading LLC

Inflation, Hard Data and Soft Data

Inflation, Hard Data and Soft Data Hard data are back above long-run averages. But the chart clearly shows the divergence between hard data and soft data. Image: Arbor Research & Trading LLC

Hard Economic Data

Hard Economic Data Hard economic data is improving in Eurozone, Asia Pacific, Latin America and the United States. Image: Arbor Research & Trading

Economic Data Bouncing Back

Economic Data Bouncing Back Great chart showing that economic data around the world is beginning to improve. Image: Arbor Research & Trading LLC

U.S. Hard Data vs. Soft Data

U.S. Hard Data vs. Soft Data U.S. hard data is improving, but the chart shows the current divergence between U.S. hard data and soft data. Image: Arbor Research & Trading LLC

Should Investors Trust Markets or Economic Data?

Should Investors Trust Markets or Economic Data? Nancy Tengler, Butcher Joseph Chief Investment Strategist, and Brian Levitt, Oppenheimer senior investment strategist, discuss the economic data. They are mixed, but that’s good news. Equities are going higher and investors should have FOMO (Fear of Missing Out).

U.S. Stock Market Bull and Bear Indicator

U.S. Stock Market Bull and Bear Indicator Using multiple financial data, this great model helps investors navigate through different market conditions. It suggests whether the U.S. stock market tendency is bullish, bearish or neutral. It is a contrarian indicator. A bullish signal suggests that the U.S. stock market may go up, while a bearish signal…