U.S. Housing Demand and Mortgage Delinquencies
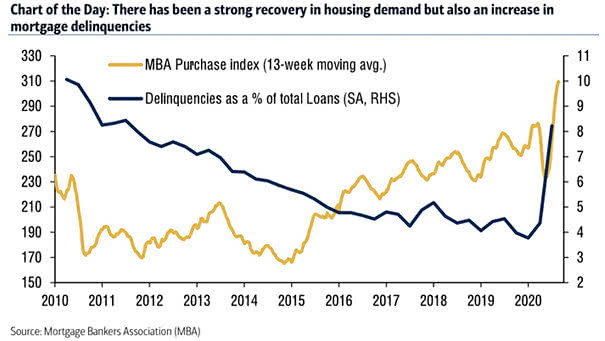
U.S. Housing Demand and Mortgage Delinquencies A strong recovery in housing demand, but an increase in mortgage delinquencies. The wealth gap is widening in the United States. Image: BofA
U.S. Housing Demand and Mortgage Delinquencies A strong recovery in housing demand, but an increase in mortgage delinquencies. The wealth gap is widening in the United States. Image: BofA
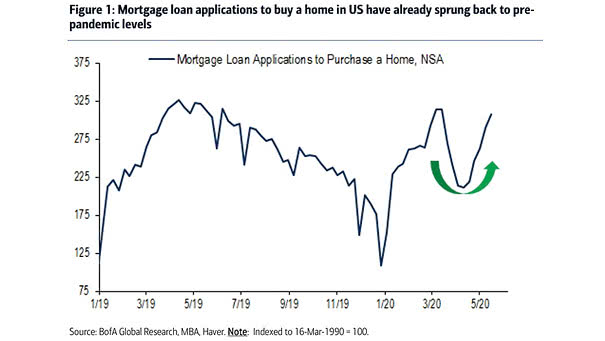
Housing – Mortgage Loan Applications to Purchase a Home in the U.S. Mortgage loan applications to purchase a home in the U.S. are back to pre-pandemic levels. Image: BofA Global Research

Housing – U.S. Median Famility Income to Mortgage Cost This chart suggests that relative to family incomes, buying a home in the U.S. is currently quite affordable by historical standards. Image: Gavekal, Macrobond
Delinquency – U.S. Unemployment Rate and Mortgage Loans Past Due The rising unemployment rate in the United States should increase the delinquency rate. Image: Oxford Economics
U.S. 10-Year Treasury Yield and Mortgages Rates U.S. treasury yields and mortgage rates aren’t following the usual pattern over the last 6 weeks (R² = 0.93). Image: Macrobond Financial
Housing – U.S. Existing Home Sales and 30-Year Mortgage Rate This chart shows the correlation between U.S. existing home sales and the 30-year mortgage rate (inverted), and suggests further improvements in sales. Image : Piper Sandler Companies
U.S. Mortgage Rates and New Home Sales The decline in mortgage rates has given a strong boost to new home sales. Image: Macrobond
America’s Mortgage Debt by State The average mortgage debt per capita in the United States is $33.680. Image: howmuch.net
U.S. Monthly Average 30-Year Fixed Mortgage Rates Keep in mind that mortgage costs are influenced by the 10-year Treasury yield. 30-year mortgage rates = 1.739 x (10-year treasury yield)² + 0.7755 x (10-year treasury yield) + 0.0227(R² = 0.9787) You may also like “30-Year Mortgage Rates vs. 10-Year Treasury Yield.” Image: Leonard Kiefer
30-Year Mortgage Rates vs. 10-Year Treasury Yield There is a very high correlation between the 30-year mortgage rates and the 10-year treasury yield 30-year mortgage rates = 1.739 x (10-year treasury yield)² + 0.7755 x (10-year treasury yield) + 0.0227 R² = 0.9787 Image: Calculated Risk
US Long-Term Mortgage Rates Decline: 30-Year Average 4.10% & 15-Year Average 3.57% Why US long-term mortgage rates decline? Mortgage costs are influenced by the 10-year Treasury yield which was lower this week, because the trade war between the United States and China pushes investors moving money from stocks to bonds. Bond yields fall as prices rise.…