U.S. Nonfarm Payroll Growth and Unemployment Rate
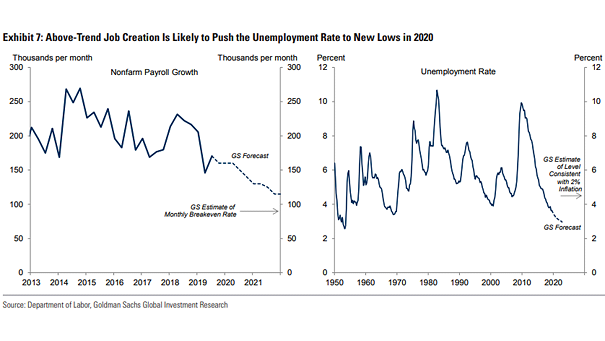
U.S. Nonfarm Payroll Growth and Unemployment Rate Goldman Sachs expects new lows in the U.S. unemployment rate in 2020. Image: Goldman Sachs Global Investment Research
U.S. Nonfarm Payroll Growth and Unemployment Rate Goldman Sachs expects new lows in the U.S. unemployment rate in 2020. Image: Goldman Sachs Global Investment Research
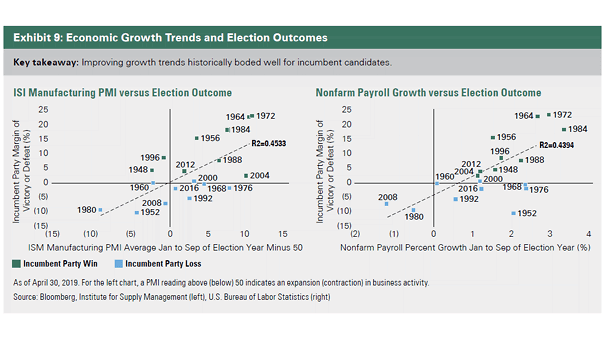
ISM Manufacturing PMI and Nonfarm Payroll Growth vs. U.S. Election Outcome Chart showing the relationship between growth trends into U.S. elections and the margin of victory or defeat for incumbent candidates. Historically, the probability of incumbents winning an election increases, as growth trends improve. Image: Bessemer Trust

Stall Probability by Scenario for U.S. Payroll Employment Chart suggesting that stall risks rise considerably and could intensify with greater deceleration in payroll employment in 2020. Image: Barclays Research
S&P 500 Return vs. NonFarm Payrolls Since 1988, the cumulative return of the S&P 500 has been much better when nonfarm payrolls have exceeded 100,000. Image: Pictet Wealth Management
U.S. Consumer Spending and Nonfarm Payroll Growth U.S. consumers may spend less going forward. Slower job growth usually leads to a slowdown in consumer spending. Image: BofA Merrill Lynch Global Research
U.S. Nonfarm Payroll Employment During this business cycle, America has added over 20 million jobs. Image: Leonard Kiefer
Overtime Hours Lead U.S. Nonfarm Payrolls Great chart suggesting that overtime hours lead U.S. nonfarm payrolls by 3 months (R = 0.90). Image: Paolo Cardena
U.S. Nonfarm Payrolls vs. Overtime Hours and Recessions This chart shows that overtime hours are a leading indicator for where U.S. nonfarm payrolls might be headed, and generally turn negative prior to a recession.
Manufacturing Payrolls vs. ISM PMI Manufacturing payrolls are usually quite volatile, but this interesting chart could suggest a rebound in the ISM PMI. Let’s wait for confirmation in the second half of the year. Image: Hayek and Keynes
U.S. Total Nonfarm Payrolls and Recessions Total nonfarm payrolls increased 224K in June, well above expectations, which should calm fears of a near-term recession. The job market is still strong, even if there are signs it is slowing down. Actually, nonfarm payroll growth tends to decline before a recession. You may also like “What Is…