U.S. Unemployment Rate Projection
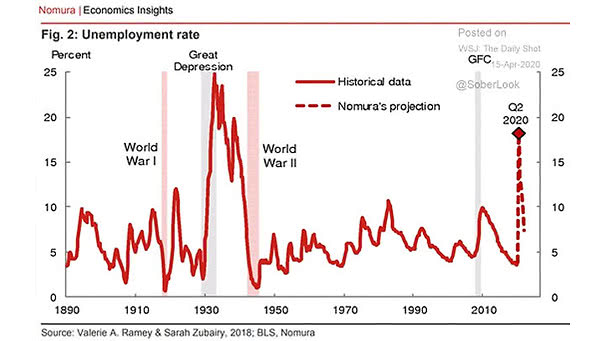
U.S. Unemployment Rate Projection This chart shows the Nomura’s forecast for US unemployment. Image: Nomura
U.S. Unemployment Rate Projection This chart shows the Nomura’s forecast for US unemployment. Image: Nomura
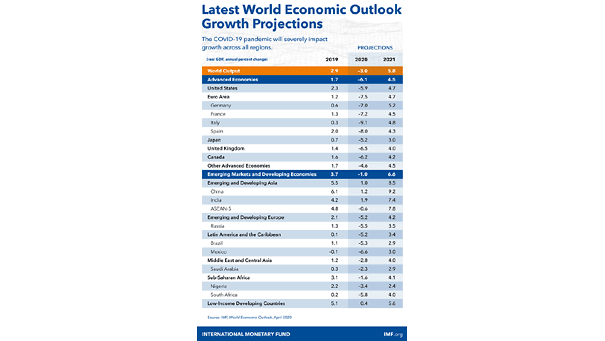
Global Real GDP – Latest World Economic Outlook Growth Projections This table suggests the coronavirus pandemic impact on growth across all regions. Image: International Monetary Fund

S&P 500, Treasury Bond, Global GDP, EUR/USD – Protracted Scenario Projections This table suggests protracted scenario projections. Image: Deutsche Bank Research
U.S. Deficit Projection Chart suggesting that the next recession could boost the U.S. deficit to unprecedented levels. Image: Piper Sandler
Demographics – U.S. Population Projections Under Alternative Immigration Scenarios In a high immigration scenario, the U.S. population is projected to grow to 446.9 million in 2060. Image: U.S. Census Bureau
S&P 500 Levels, Bank Projections Morgan Stanley is a bear, but Wall Street expects gains for the S&P 500 in 2020 Image: Financial Times
Global Economy – 2020 Global GDP Projection The global economy is expected to grow by just 2.9% in 2020. Image: Bloomberg
S&P 500 Projection Based on Years When Index Gains at Least 15% by April The chart shows the S&P 500 projection based on years when the index gains at least 15% by April (11 times since 1928). This is not a forecast. Image: Wojciech Białek, Macrobond
Fed Balance Sheet Projection According to the NY Fed, the Fed’s balance sheet could be between $3.8 trillion and $4.7 trillion by 2025. Image: UBS
China Real GDP Growth Projection Real GDP growth in China is expected to continue to decline significantly in the coming years, with consumption becoming the main driver of growth. You may also like “Contribution of Consumption to China’s GDP Growth.” Image: KKR & Co.
Change in the Summary of Economic Projections This chart shows the change in the summary of economic projections from March to June 2019. Image: Evercore ISI