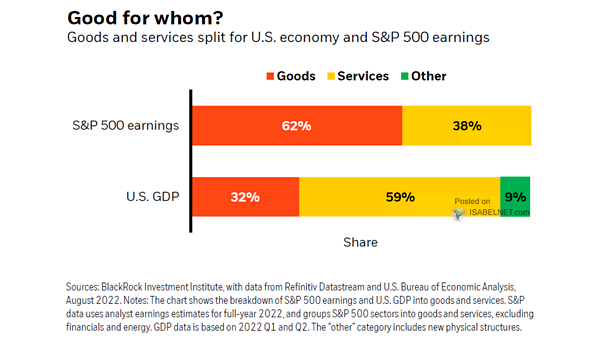
Goods and Services Split for U.S. Economy and S&P 500 Earnings
Goods and Services Split for U.S. Economy and S&P 500 Earnings Cooling demand for goods could hit U.S. stocks. Image: BlackRock Investment Institute
Goods and Services Split for U.S. Economy and S&P 500 Earnings Cooling demand for goods could hit U.S. stocks. Image: BlackRock Investment Institute
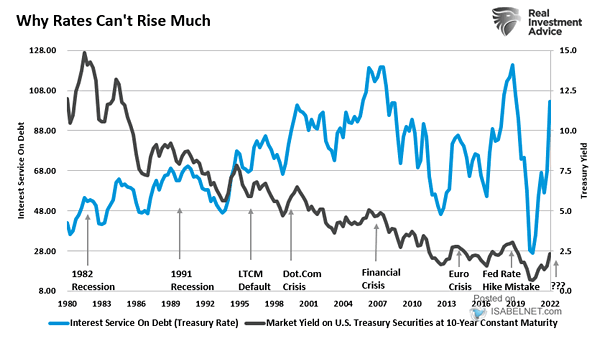
Interest Service On Debt (Treasury Rate) and Market Yield on U.S. Treasury Securities at 10-Year Constant Maturity Could the Fed’s rate hikes lead to a federal debt crisis? Image: Real Investment Advice

World Trade Volume of Goods and Services The International Monetary Fund expects global trade to rebound in 2021 and 2022. Image: Bloomberg
S&P 500 Market Capitalization Weight of Info Tech, Communication Services, and Health Care Info tech, communication services, and health care sectors now account for 52% of the S&P 500 market capitalization. Image: Goldman Sachs Global Investment Research
Private Non-Financial Debt Service Ratios Relative To Income Lower interest rates make debt more sustainable. What matters is the debt service cost.
Inflation – U.S. Core CPI Goods and Core CPI Services 20 years of almost no inflation in goods. Image: Deutsche Bank Global Research
Household Debt Service Ratios by Country China’s household debt has grown rapidly in recent years. Image: Gavekal, Macrobond
U.S. Manufacturing and Services Value Added in Percentage of U.S. GDP U.S. manufacturing has decreased over the past decades and is now more than five times smaller than the service sector. Image: Macrobond
U.S. Retail Sales and Food Services vs. Fair Value Model After disappointing U.S. retail sales in September, this chart provides a good forward guide for U.S. consumer spending. The Fair Value Model leads consumption and includes: ASA Staffing Index (temps), spread between good unemployment (job leavers) and bad unemployment (job losers), and forward-looking income expectations.…
World Economy – Services as Share of Total GDP Services account for about 65% of global GDP and about 77% of the United States’ GDP. Image: howmuch.net
Global Manufacturing vs. Service Sector This chart shows that the global manufacturing sector is in recession, while the service sector is doing well. Image: Deutsche Bank Global Research