U.S. High Yield Spreads
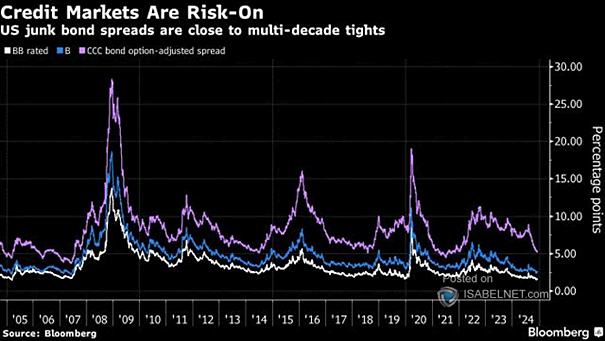
U.S. High Yield Spreads Having tight credit spreads is like being on a rollercoaster with no safety bar—looks fun until you realize you should’ve paid more attention! Image: Bloomberg
U.S. High Yield Spreads Having tight credit spreads is like being on a rollercoaster with no safety bar—looks fun until you realize you should’ve paid more attention! Image: Bloomberg
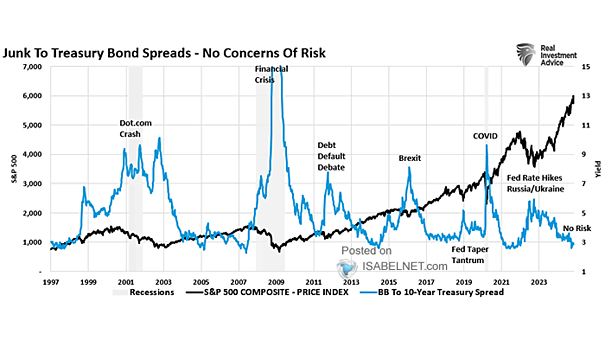
S&P 500 Index and BB to 10-Year Treasury Spread Closely monitoring the junk to Treasury bond spread can provide valuable insights into the overall health and direction of the U.S. stock market, making it an important leading indicator to watch. Image: Real Investment Advice

U.S. IG Credit Spread U.S. investment-grade credit spreads have reached their lowest point since 2005, reflecting growing investor sentiment and confidence in future economic conditions. Image: Deutsche Bank
Spread Between BBB-Rated Corporate Bond Yield and 90-Day U.S. Treasury Bill Yield The recent increase in the spread between IG credit yield and cash yield marks a significant shift from a 43-year low. Should investors favor U.S. Treasury bills over IG bonds? Image: BofA Global Investment Strategy
High-Yield (HY) Spread USD Goldman Sachs forecasts a favorable high-yield bond market over the next 12 months, anticipating tighter spreads as a result of robust economic conditions and optimistic investor sentiment. Image: Goldman Sachs Global Investment Research
Investment Grade (IG) Spread According to Goldman Sachs, Investment Grade (IG) spreads are expected to remain virtually unchanged over the next 12 months. Image: Goldman Sachs Global Investment Research
U.S. Investement Grade Corporate Bond Spreads Will U.S. Investment Grade corporate bond spreads remain unchanged for an extended period? Image: BofA Global Investment Strategy
Correlation Between AAII Bull-Bear Spread and S&P 500 Returns The AAII bull-bear spread may not necessarily be a reliable predictor of future S&P 500 returns. Image: BofA US Equity & Quant Strategy
GAAP Earnings vs. PPI to CPI Spread The PPI to CPI spread suggests that there could be ongoing pressure on earnings. Image: Real Investment Advice
U.S. Yield Curve – Which Yield Spread Matters? An inverted yield curve, which has preceded every U.S. recession over the past 50 years, is something that investors should care about. Image: Real Investment Advice
ISM Manufacturing Index vs. U.S. HY – IG Spread The ISM Manufacturing Index in contraction is a sign of a potential recession, while the tight U.S. HY/IG spread suggests continued positive growth. Image: BofA Global Investment Strategy