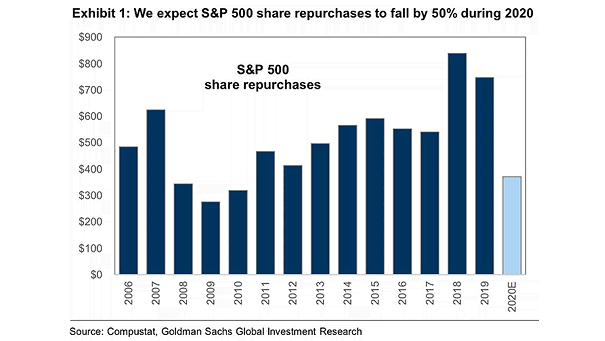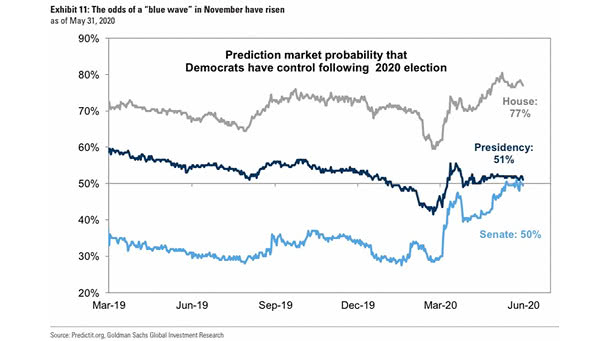
Prediction Market Probability That Democrats Have Control Following 2020 Election
Prediction Market Probability That Democrats Have Control Following 2020 Election According to Goldman Sachs, the odds of a “blue wave” in November have risen and could lift the effective S&P 500 tax rate from 18% back to 26%, reducing the 2021 EPS forecast from $170 to $150. Image: Goldman Sachs Global Investment Research