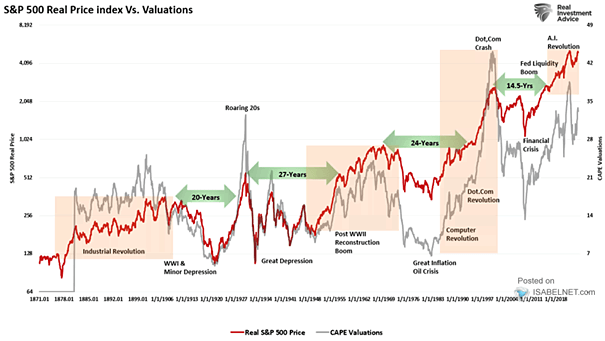
S&P 500 Levels, Bank Projections

S&P 500 Levels, Bank Projections Morgan Stanley is a bear, but Wall Street expects gains for the S&P 500 in 2020 Image: Financial Times

Long-Term U.S. Dollar Cycles

Long-Term U.S. Dollar Cycles This chart shows bear and bull cycles in the U.S. dollar. Will the U.S. dollar enter a bear market? Image: Alpine Macro

S&P 500 Earnings

S&P 500 Earnings So far, S&P500 earnings are not down dramaticaly as in previous bear markets. Image: Quercus TFI S.A.

S&P 500 Valuation

S&P 500 Valuation This chart shows that the S&P 500 is in a trading range rather than in a bearish or bullish market trend, for more than 20 months. Image: Fidelity Investments

Equity Market Driven by Bonds Not Profits

Equity Market Driven by Bonds Not Profits The chart shows a widening gap between cyclicals and bond proxies. It is clearly a cyclical bear market within a bull market, as during the dotcom bubble. Image: Societe Generale Cross Asset Research

First, Middle, Final Years of S&P 500 Bull Markets since 1975

First, Middle, Final Years of S&P 500 Bull Markets since 1975 The chart shows that the S&P 500 has generated a 26.9% return on average, in the final years of bull markets since 1975, excluding the current bull market. You may also like “Equity Market Performance Around Bear Markets.” Image: Legg Mason

First Fed Rate Cut

First Fed Rate Cut History tells us that a first 25-bps rate cut is bullish, while a first 50-bps rate cut is bearish. You may also like “U.S. Equities – One Year Return After a Fed Rate Cut.” Image: Ari Wald

Weekly AAII Investor Sentiment Survey

Weekly AAII Investor Sentiment Survey Bulls push above bears, but when doubt and fear are still present, it does not usually look like a major market top. Image: Reuters

New Secular Bull Market?

New Secular Bull Market? This chart shows a perspective on secular bull and bear markets since 1930. Picture Source: ClearBridge Investments