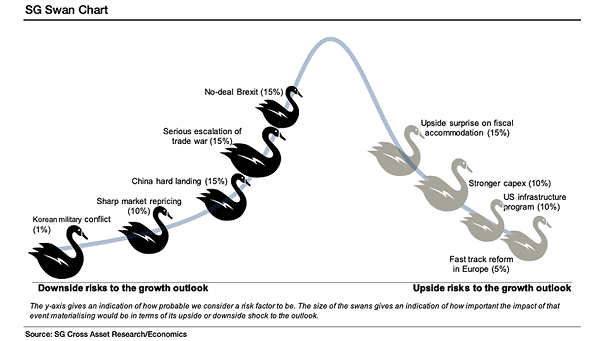
MSCI Emerging Markets Seasonality

MSCI Emerging Markets Seasonality Chart showing the MSCI EM seasonality chart since 1990. This is not a forecast. Image: Goldman Sachs Global Investment Research

Nasdaq 100 and S&P 500 Seasonality

Nasdaq 100 and S&P 500 Seasonality The Nasdaq 100 and S&P 500 seasonality chart from 1985 to 2018 (excluding 2008). This is not a forecast. Image: Goldman Sachs

Seasonality – S&P 500 Cycle Composite for 2019

Seasonality – S&P 500 Cycle Composite for 2019 This great chart shows the S&P 500 cycle composite for 2019 vs. the actual S&P 500 composite (places equal weight on: one-year seasonal cycle, four-year presidential cycle, and 10-year decennial cycle). This is not a forecast. Image: Ned Davis Research

U.S. Monetary Policy and Recession

U.S. Monetary Policy and Recession This chart shows the U.S. monetary policy and two recession forecasting models over time (Fed policy rate, Atlanta Fed shadow Fed funds rate, nominal R-Star, Fed funds curve). Image: Fidelity Investments

Consensus 2019 & 2020 U.S. Real GDP Growth

Consensus 2019 & 2020 U.S. Real GDP Growth Goldman Sachs forecasts U.S. real GDP growth of 2.3% in 2019 and 2.2% in 2020 (as of July 2019). Image: Goldman Sachs

What About the Predictive Power of the Fed?

What About the Predictive Power of the Fed? As former Fed policymaker Narayana Kocherlakota said in 2016: “Don’t rely on FOMC forecasts of future fed funds rates.” Why? Because the economy is often shaken by crises and does not evolve as expected. Image: Hedgeye Risk Management LLC

10-Year Treasury minus 1-Year Treasury Yield Spread vs. S&P 500 Returns

10-Year Treasury minus 1-Year Treasury Yield Spread vs. S&P 500 Returns If history helps us to predict the future, the 10y-1y treasury yield spread suggests low returns ahead for U.S. stocks. After 10 years of a bull market, our stock market forecasting model also shows that the market follows a different path in 2019. Statistically,…