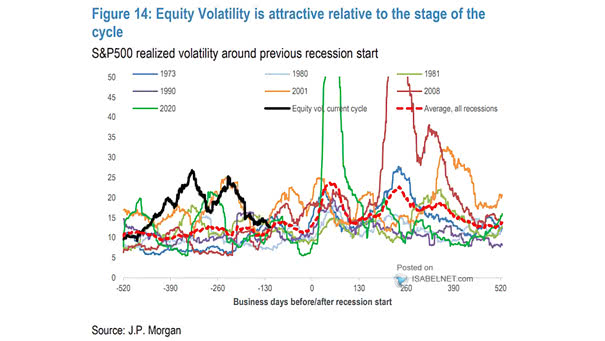
S&P 500 Realized Volatility Around Previous Recession Start
S&P 500 Realized Volatility Around Previous Recession Start U.S. equity volatility looks attractive. Image: J.P. Morgan
S&P 500 Realized Volatility Around Previous Recession Start U.S. equity volatility looks attractive. Image: J.P. Morgan
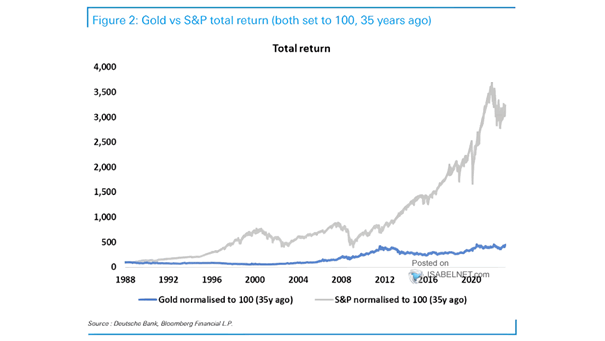
Gold vs. S&P 500 Total Return Historically, both gold and U.S. equities have delivered positive returns to long-term investors. Image: Deutsche Bank

Sentiment – NAHB Home Builder Optimism Index U.S. home builder sentiment improved for the fourth consecutive month in April, which is good news for the housing market. Image: The Daily Shot
S&P 500 – NDR Multi-Cap % Stocks >10-Day Monving Average of 93% or More In recent history, when 93% of U.S. stocks or more are above their 10-day moving average, good things tend to happen over the next 12 months. Image: Carson Investment Research
Mega-Cap Growth and Tech Earnings Do U.S. tech stocks still have room to climb? Deutsche Bank expects tech earnings to rebound. Image: Deutsche Bank
Earnings – S&P 500 12-Month Fwd EPS vs. EPS Implied by Credit and Manufacturing Surveys Could an earnings recession be a significant risk for U.S. stocks? Image: BofA Research Investment Committee
S&P 500 Returns Around the End of Fed Hiking Cycles In recent history, U.S. stocks tend to rally if there is no recession following the end of Fed hiking cycles. Image: Goldman Sachs Global Investment Research
WTI Oil Price vs. CPI Inflation (Leading Indicator) Oil prices tend to lead U.S. CPI inflation by 6 months. Image: Alpine Macro
Dividend Yield Global ex-U.S. equities continue to offer higher dividend yields than U.S. equities. Image: Topdown Charts
Russell 2000 / S&P 500 vs. ISM Manufacturing PMI (Leading Indicator) The performance of U.S. small caps relative to the S&P 500 suggests a decline in the ISM Manufacturing PMI. Image: Morgan Stanley Research
Deposits, All Commercial Banks Will U.S. banks continue to experience a decline in deposits. Image: The Daily Shot