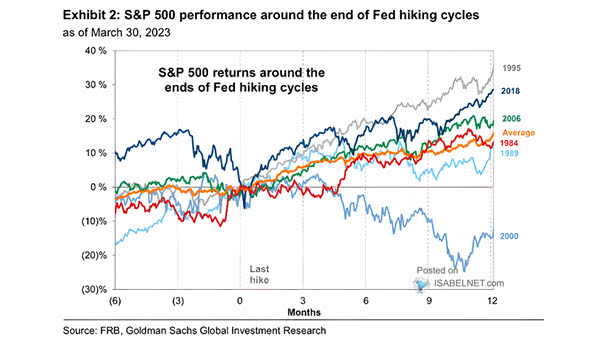
Bank Cash As a Share of Total Assets

Bank Cash As a Share of Total Assets U.S. banks have plenty of cash on hand and most banks are in very good shape. Image: Gavekal, Macrobond

LEI 6-Month ROC vs. S&P 500 EPS Annual % Change

LEI 6-Month ROC vs. S&P 500 EPS Annual % Change The 6-month annual rate of change of the Leading Economic Index is highly correlated with S&P 500 earnings growth. Should U.S. equity investors remain cautious? Image: Real Investment Advice

Near Term Forward Spread Recession Over 12 Months

Near Term Forward Spread Recession Over 12 Months The near-term forward spread indicator (spread between U.S. 3-month rates and the U.S. 3-month rate 18 months forward) is flashing red. Image: J.P. Morgan

S&P 500 Performance November – April During Midterm Years

S&P 500 Performance November – April During Midterm Years Historically, the six months from November through April have seen the best performance for U.S. stocks following midterm elections. Image: Carson Investment Research

S&P 500 Forward EPS vs. S&P 500

S&P 500 Forward EPS vs. S&P 500 Is there further downside ahead for the S&P 500, as an earnings recession is not priced into U.S. equities? Image: Morgan Stanley Research