Returns – G7 + China Free Liquidity and MSCI ACWI (Leading Indicator)

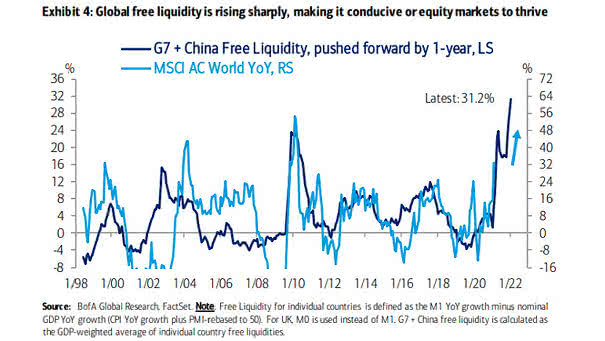
Returns – G7 + China Free Liquidity and MSCI ACWI (Leading Indicator) Global free liquidity continues to rise. When global free liquidity is above 10%, equity markets tend to perform well: the average next 12-month return is 23.4% with a hit ratio of 100% since 2009. Image: BofA Global Research

S&P 500 Foreign Sales % by Year

S&P 500 Foreign Sales % by Year The S&P 500 is more global than 2-3 decades ago, as 30% of S&P 500 sales come from overseas. Image: BofA US Equity & Quant Strategy

Valuation of Equities in the Region

Valuation of Equities in the Region FMS investors think the U.S. equity market is the most overvalued region. Image: BofA Global Fund Manager Survey

Corporate Bond Yields vs. Dividend Yields

Corporate Bond Yields vs. Dividend Yields Corporate bond yields are low compared to equity dividend yields. Image: Goldman Sachs Global Investment Research
U.S. Companies – Record Balance Sheet Cash

U.S. Companies – Record Balance Sheet Cash U.S. companies have accumulated record amounts of cash on their balance sheets to absorb the shock of the coronavirus pandemic and lockdown measures. Image: J.P. Morgan US Equity Strategy & Global Quantitative Research

M2 Money Supply Growth

M2 Money Supply Growth Is the growth in money supply the solution to boost economic growth? Image: J.P. Morgan US Equity Strategy & Global Quantitative Research

U.S. 10-Year Bond Yields Around Bear Markets

U.S. 10-Year Bond Yields Around Bear Markets Low and anchored bond yields during the recovery help to explain the strong rise in equity valuations. Image: Goldman Sachs Global Investment Research
U.S. Fund Flows (YTD Cumulative)

U.S. Fund Flows (YTD Cumulative) U.S. equity funds have seen inflows over the past few weeks, but there is still a lot of cash on the sideline. Image: Goldman Sachs Global Investment Research